Hi, I'm Athiramol
Market Researcher | Digital Marketer | Market Analyst

Data Analysis & Visualization

Excel Google Sheets Tableau Power BI Microsoft Fabric Looker Studio Qlik Sense IBM Cognos AWS QuickSight Alteryx Zoho Analytics KNIME Analytics RapidMiner Splunk

Data Engineering & ML

MySQL Apache Spark BigQuery Python R Machine Learning Azure Databricks AWS Athena Google AutoML Amazon SageMaker

Collaboration & Workflow

Lucidchart ClickUp JotForm Google Forms Microsoft Forms GitHub GitLab Jira Miro

Digital Marketing

Google Analytics Google Search Console Google Ads SEMrush Ahrefs Google Keyword Planner Canva Mailchimp Hootsuite Buffer HubSpot Hotjar BuzzSumo Meta Ads Manager CapCut Adobe Suite Sprout

Design & Web

Figma Sketch WordPress Weebly HTML Microsoft Office

Athiramol

Get to know more about my background, skills, and professional journey

Hello, I'm Athiramol PS

Market Researcher & Data Insights Professional with a strong foundation in analytics, digital marketing, and data-driven storytelling. I currently volunteer as a Market Researcher at TESYouth, UK, where I conduct topic-based research, validate datasets, and transform information into structured insights that support youth-focused initiatives.

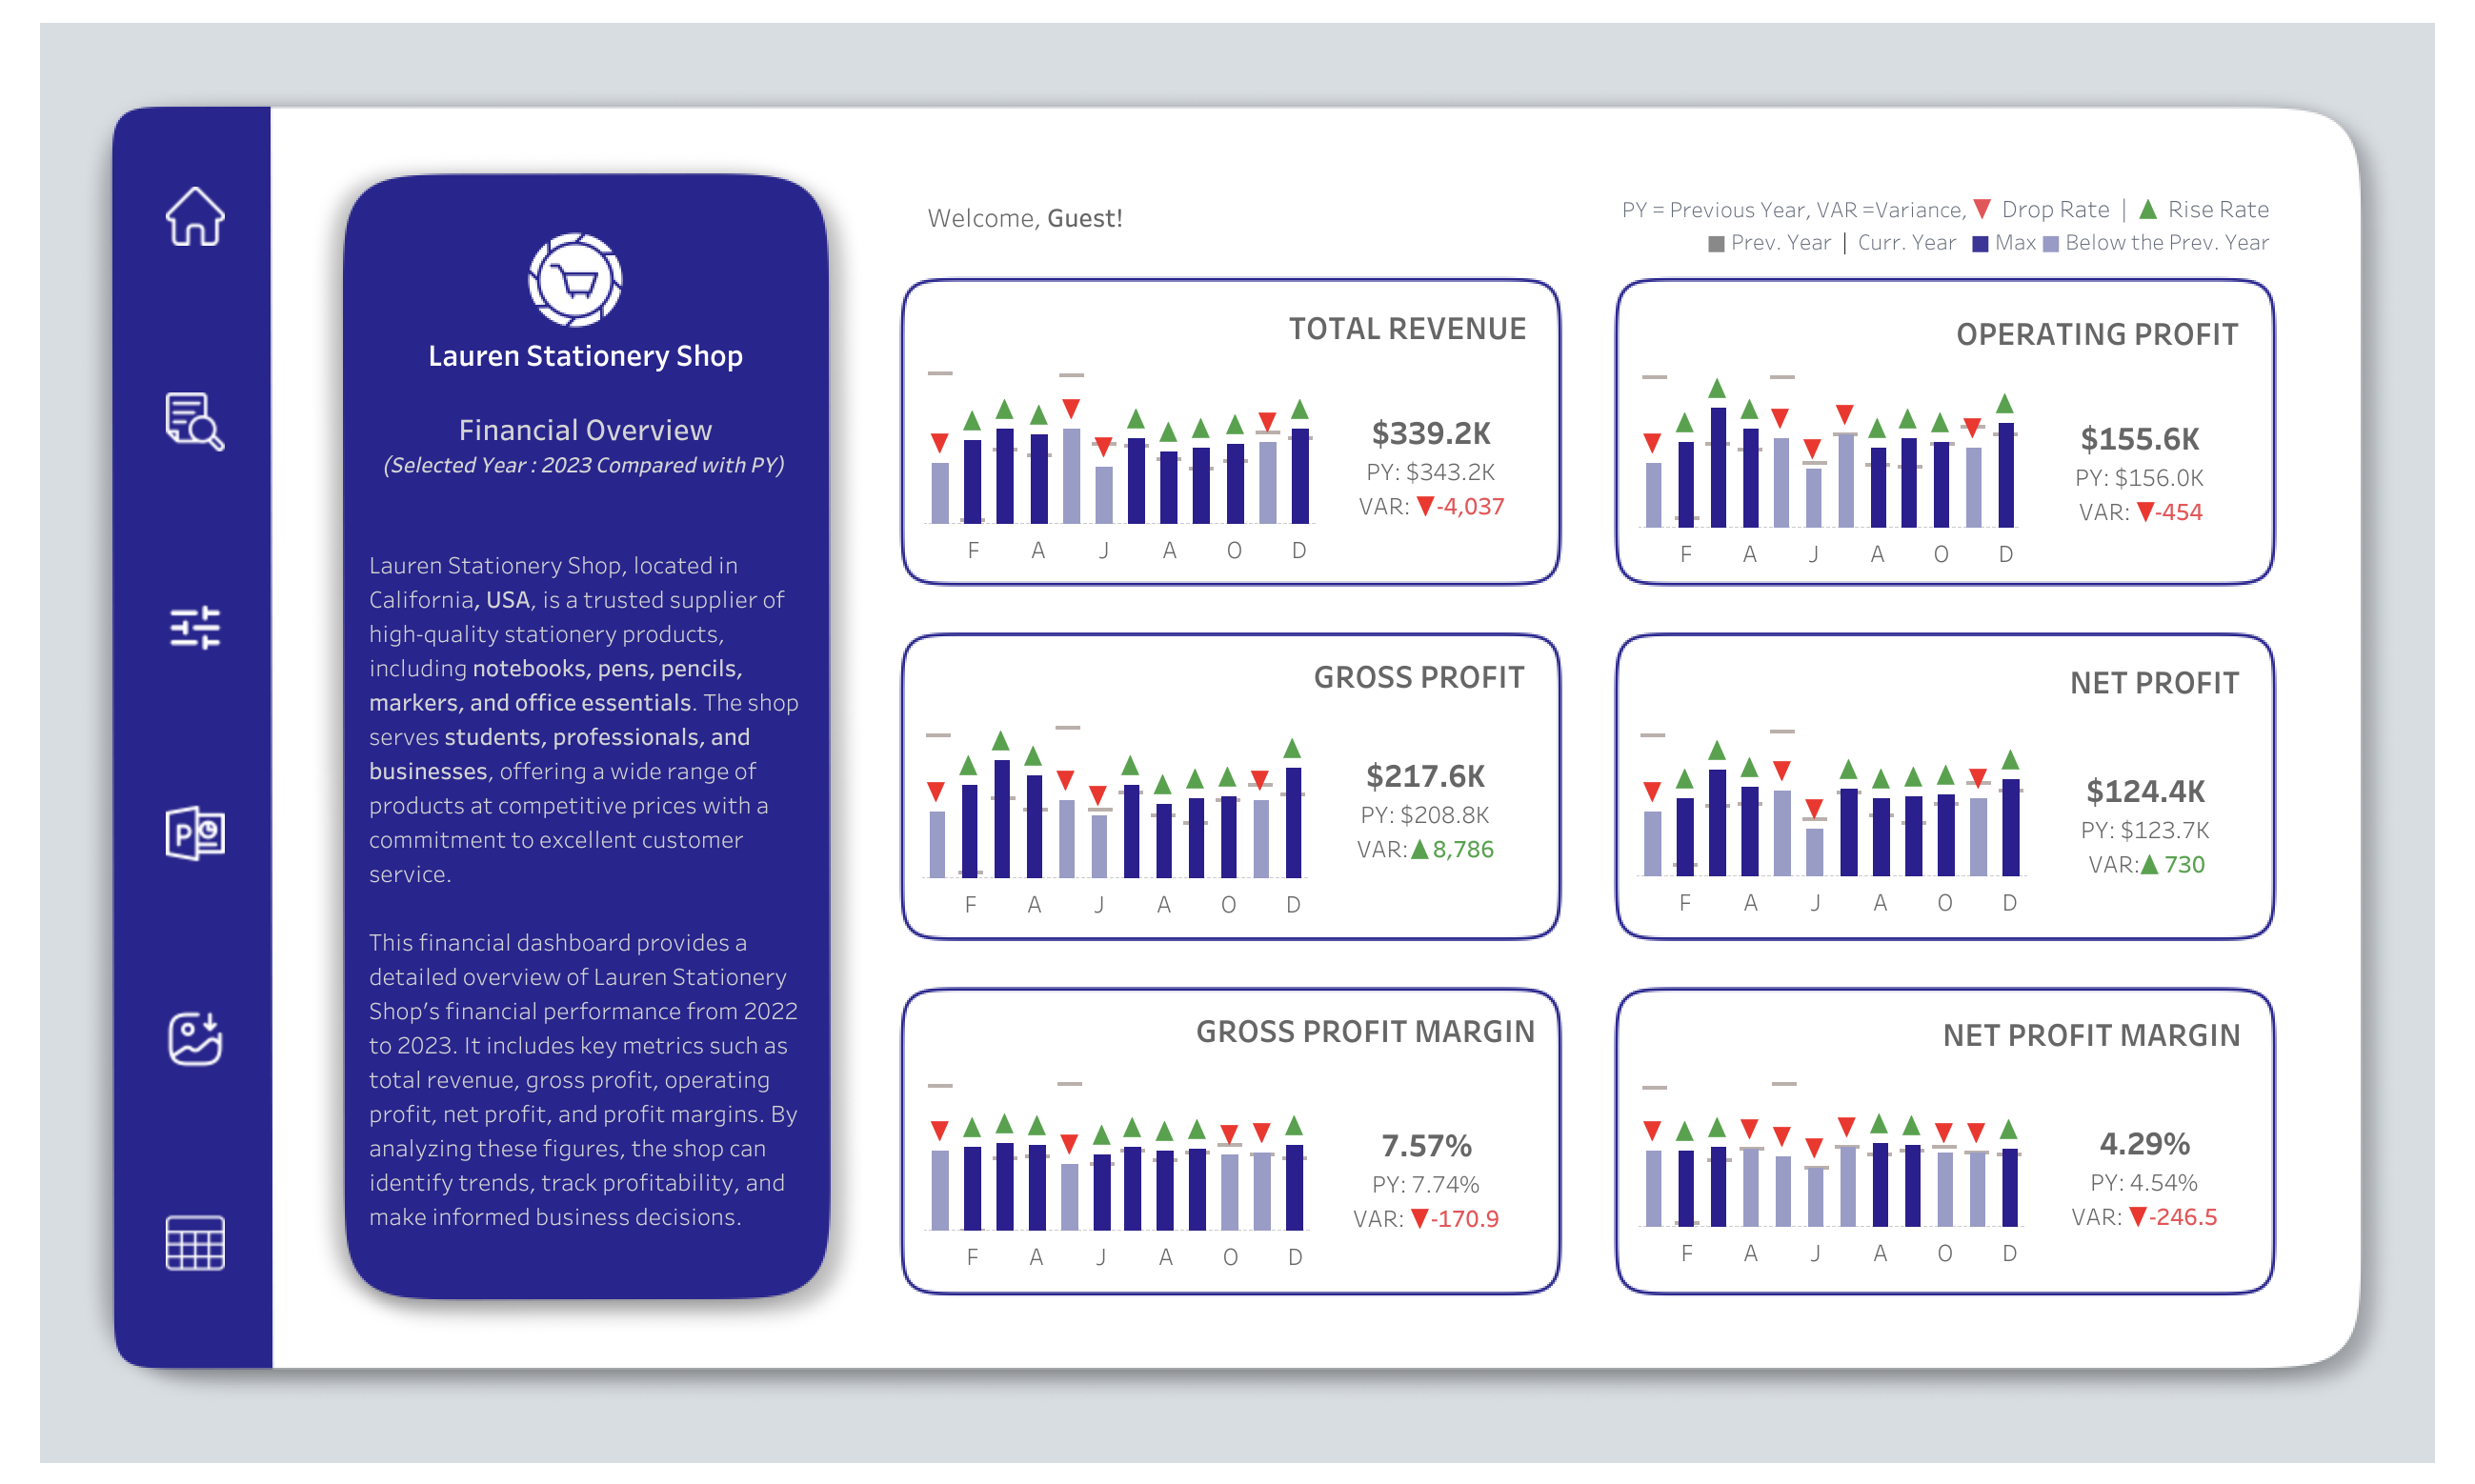
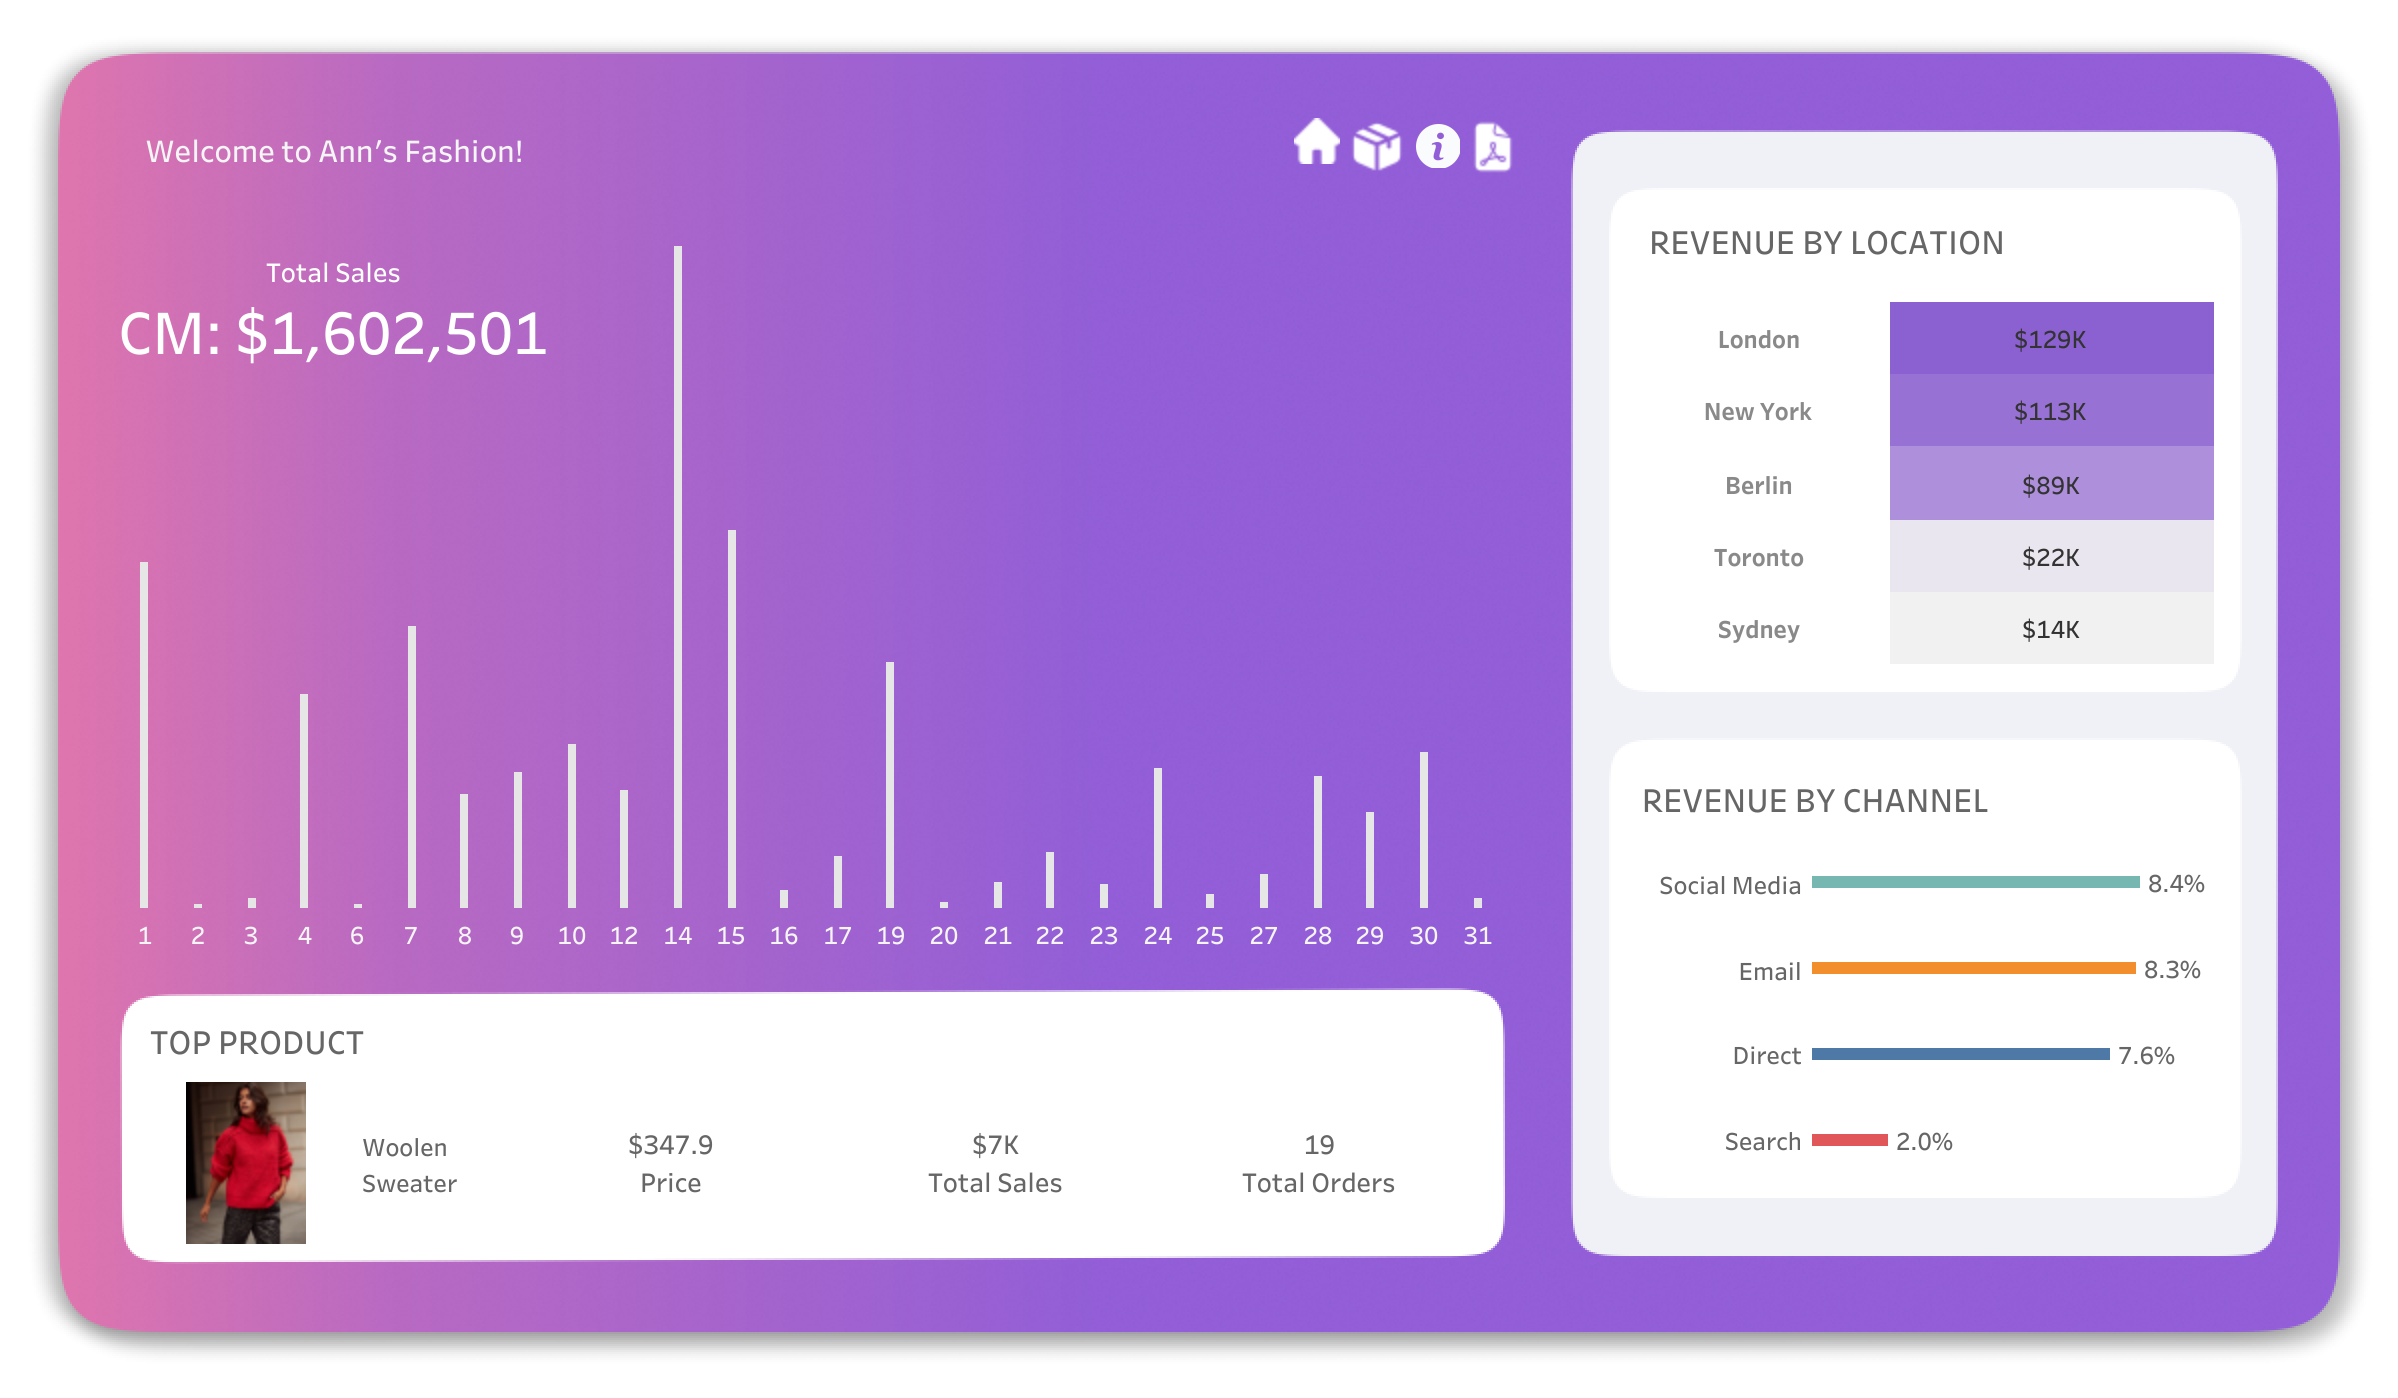
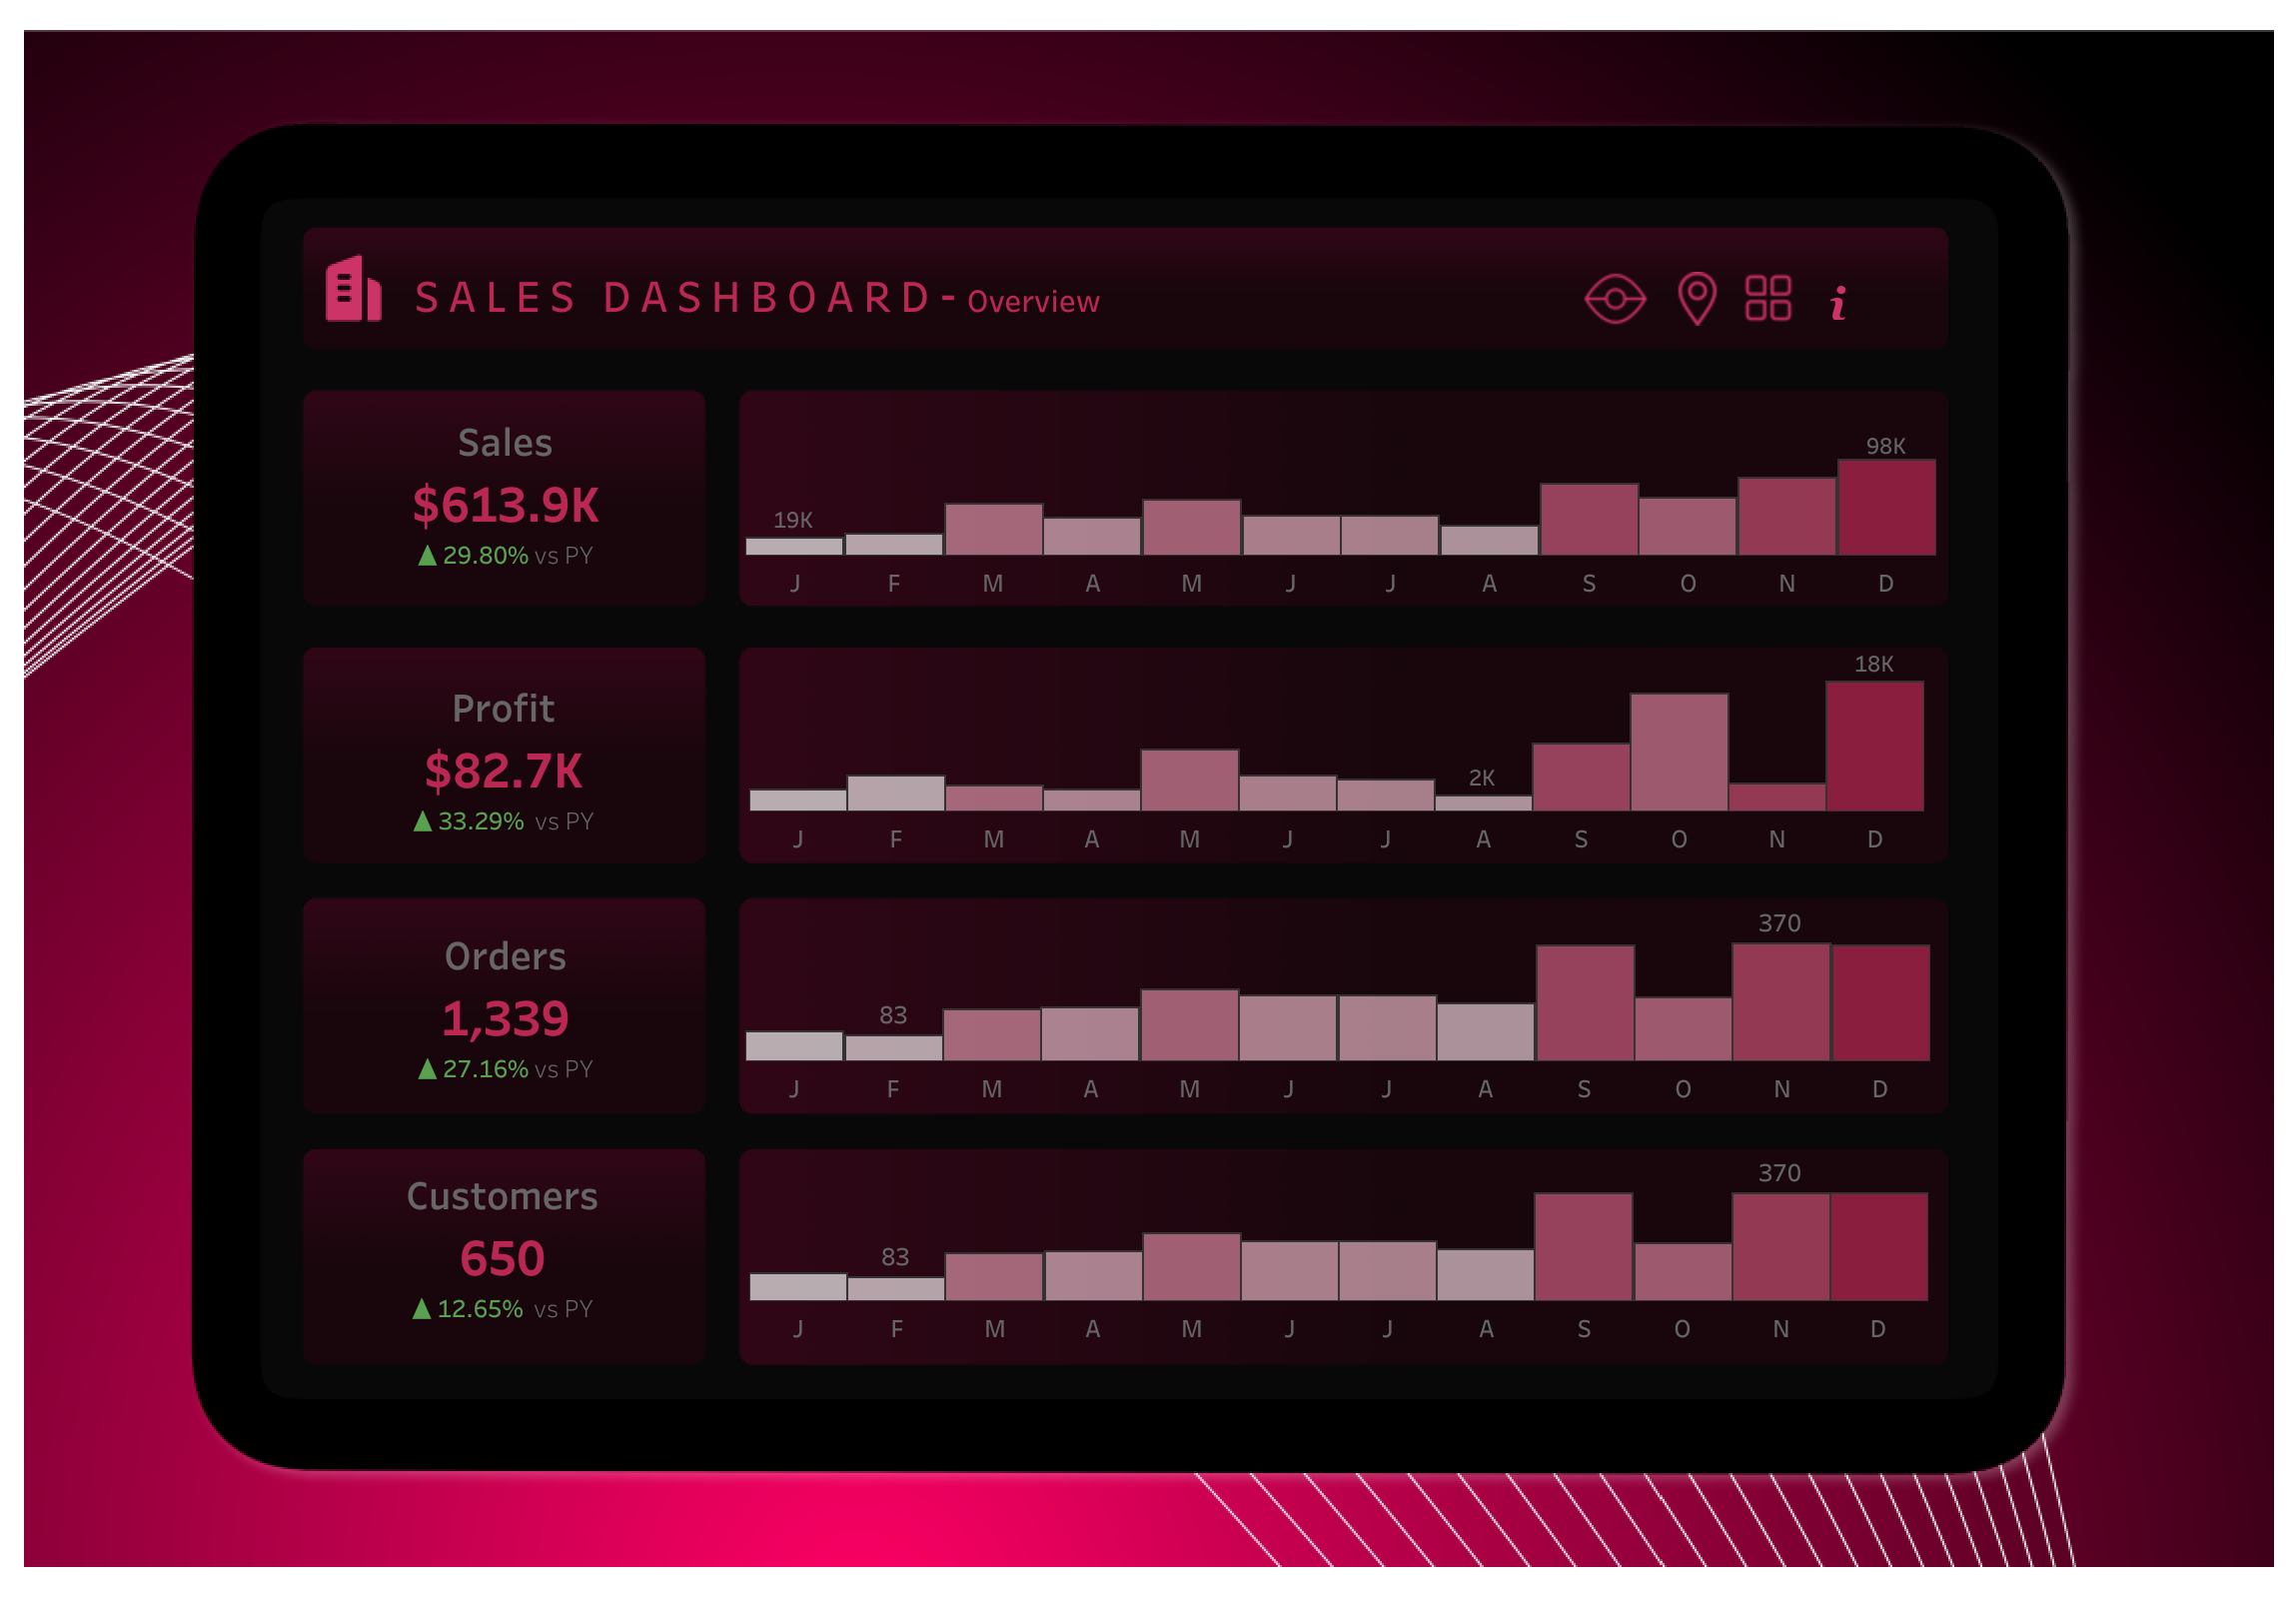
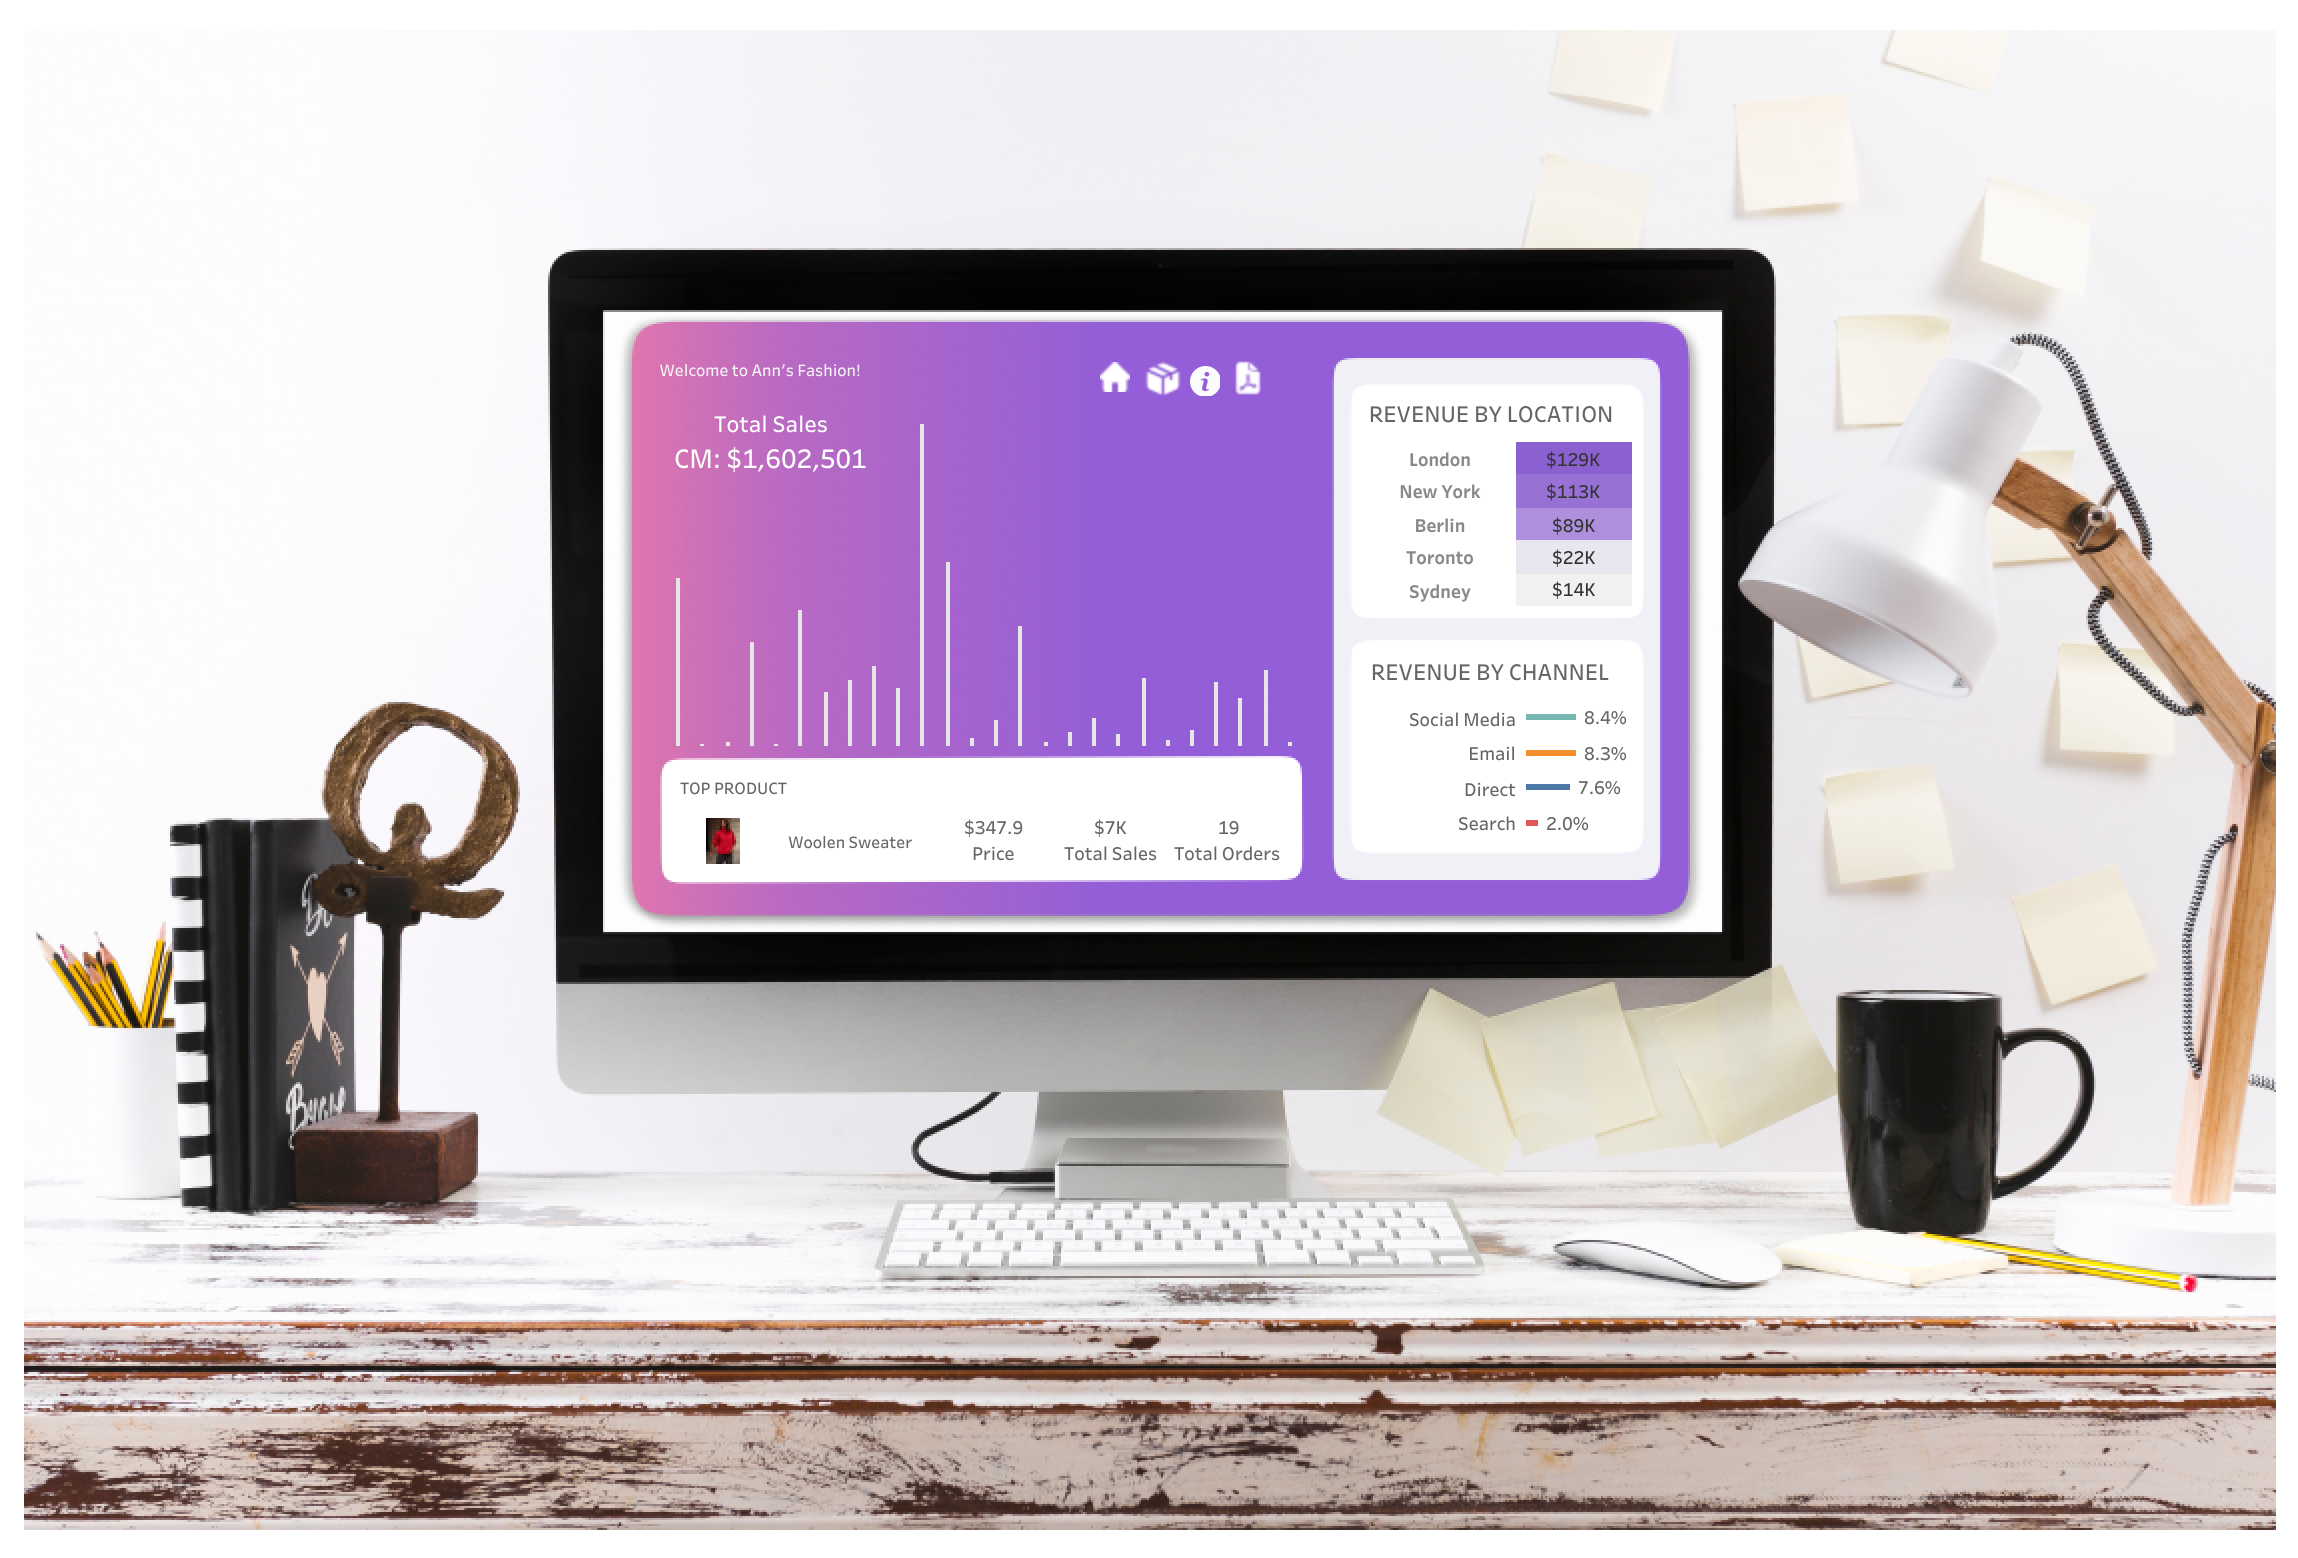
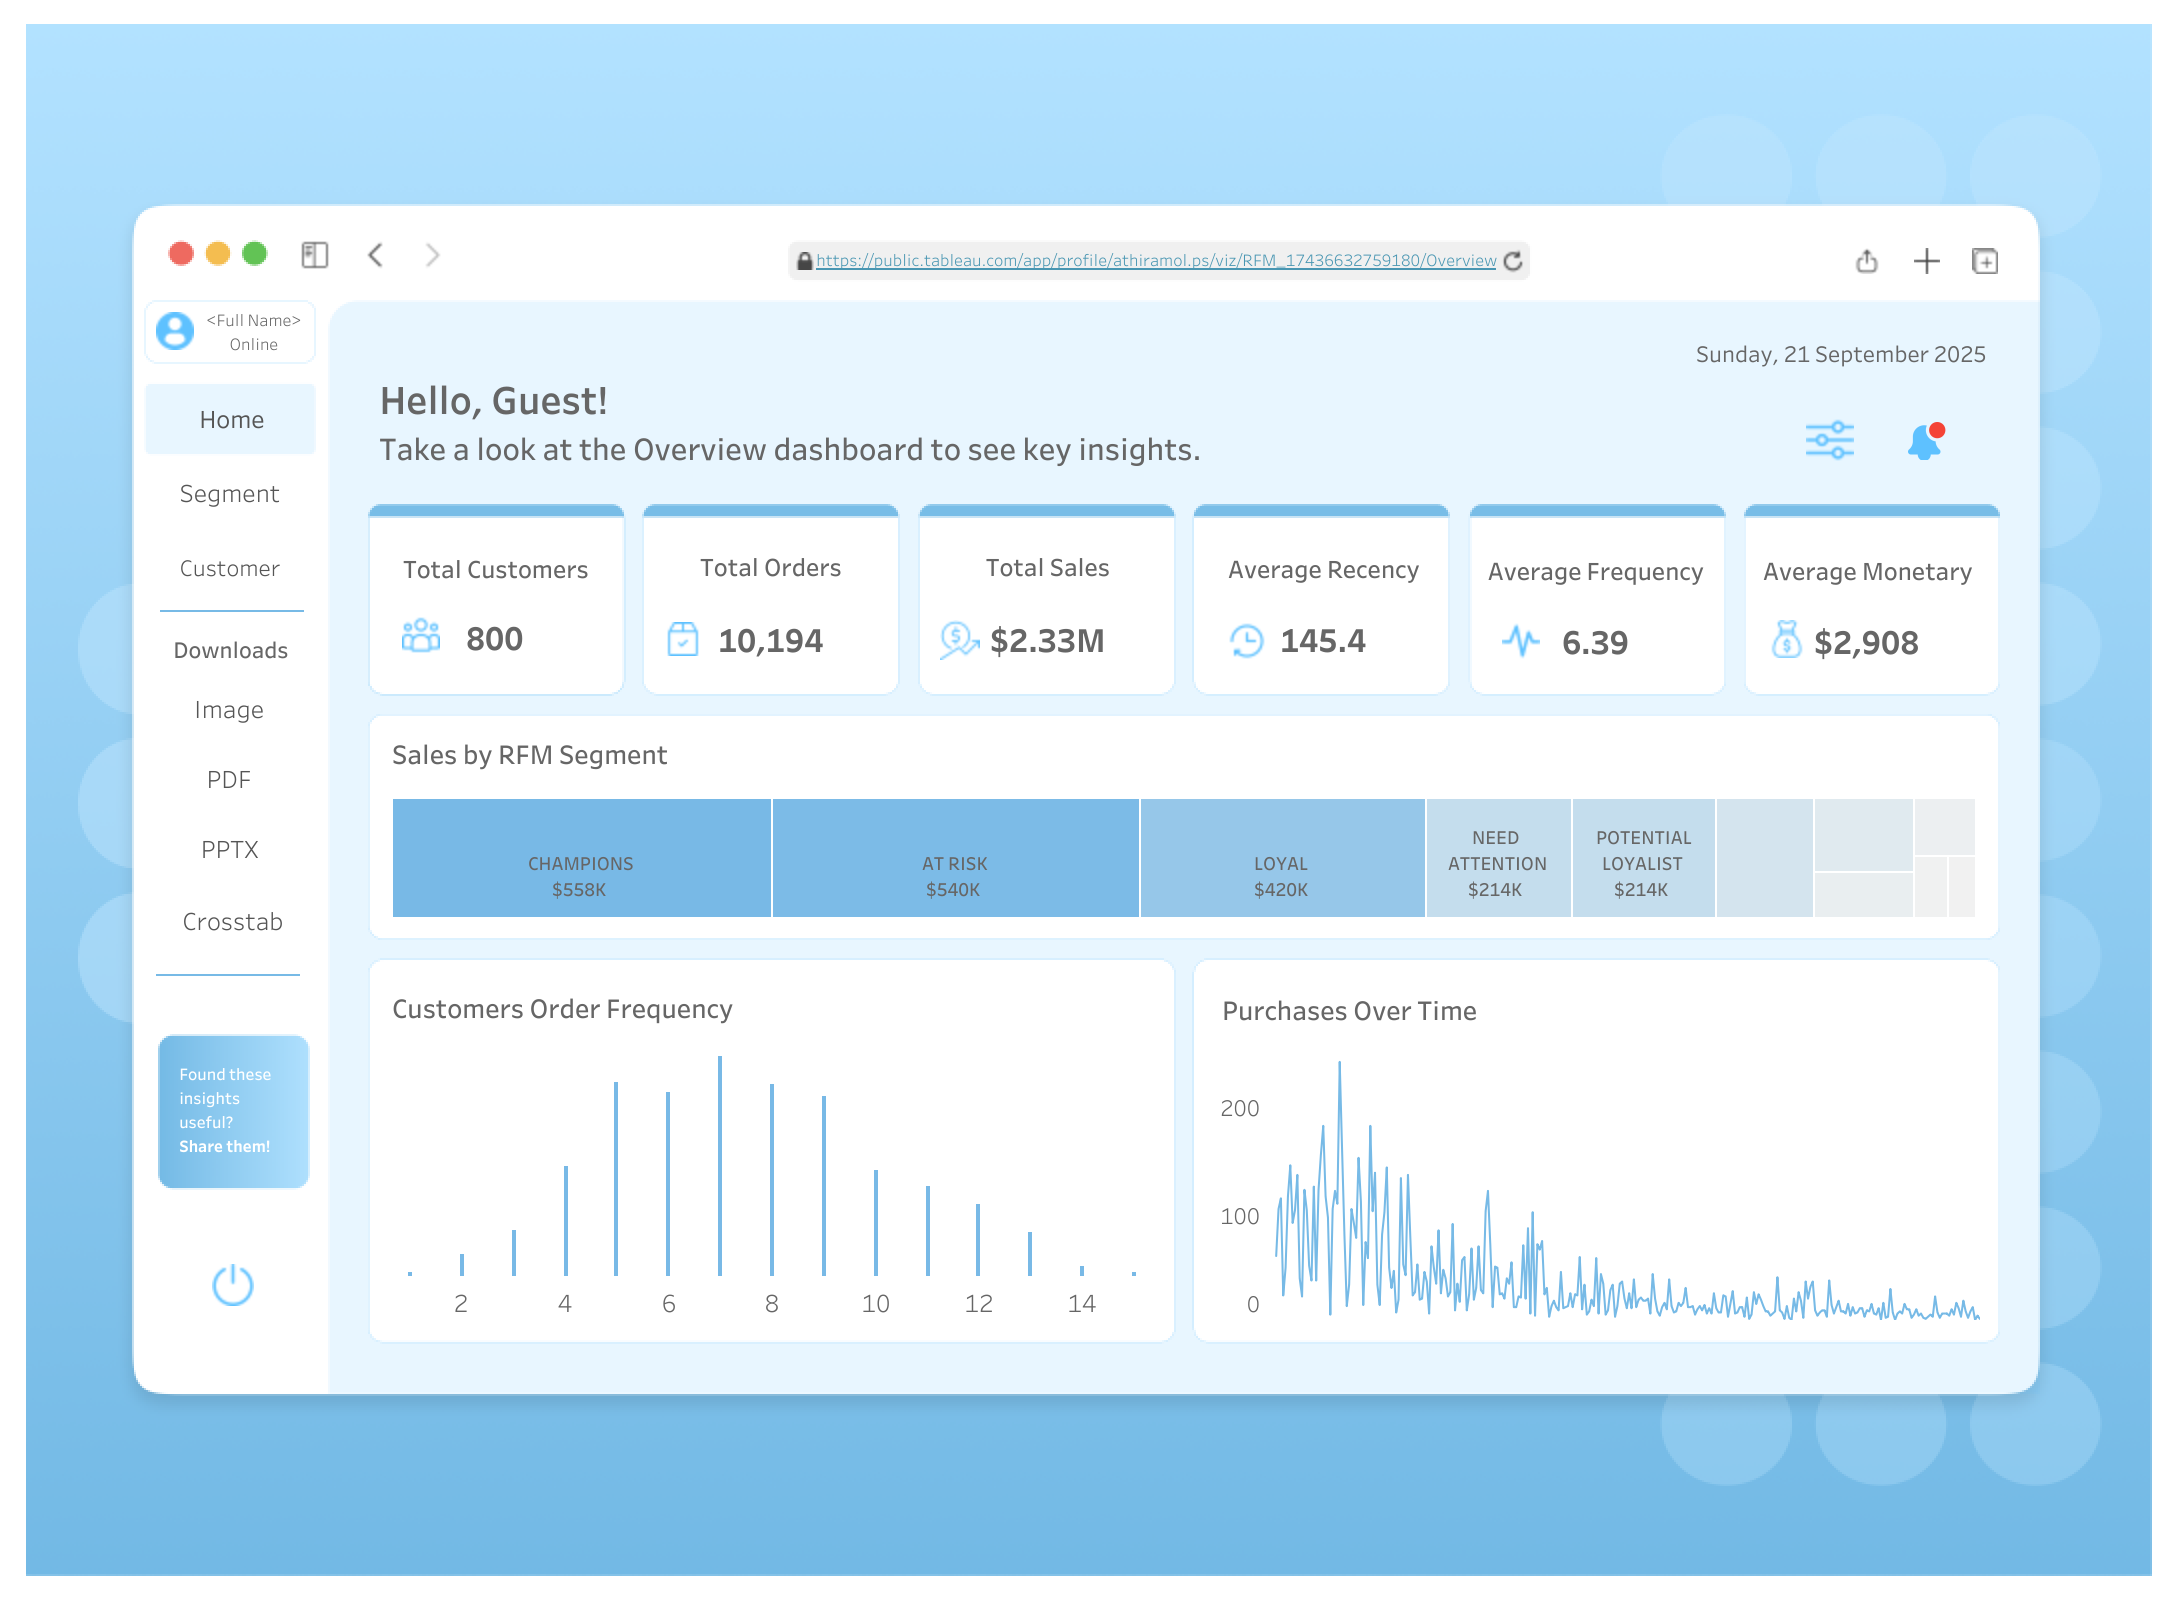
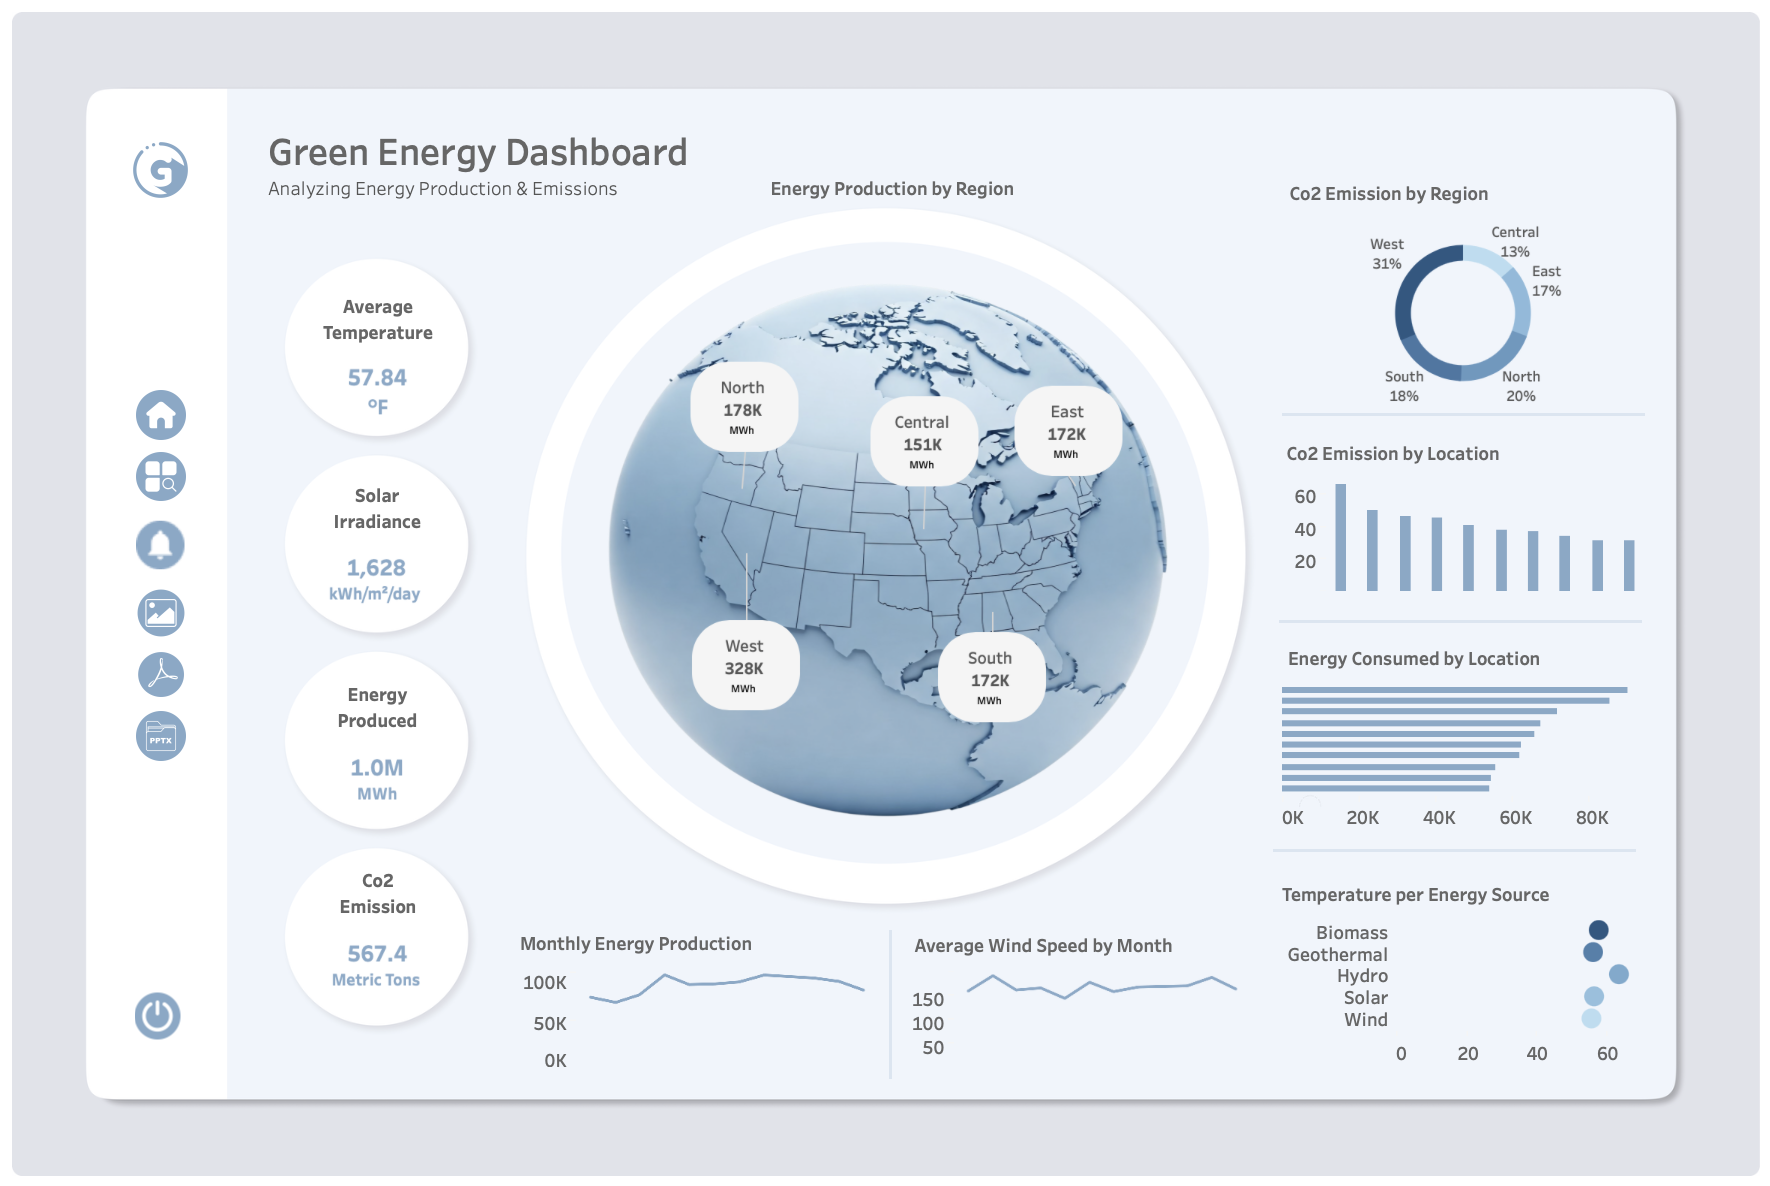
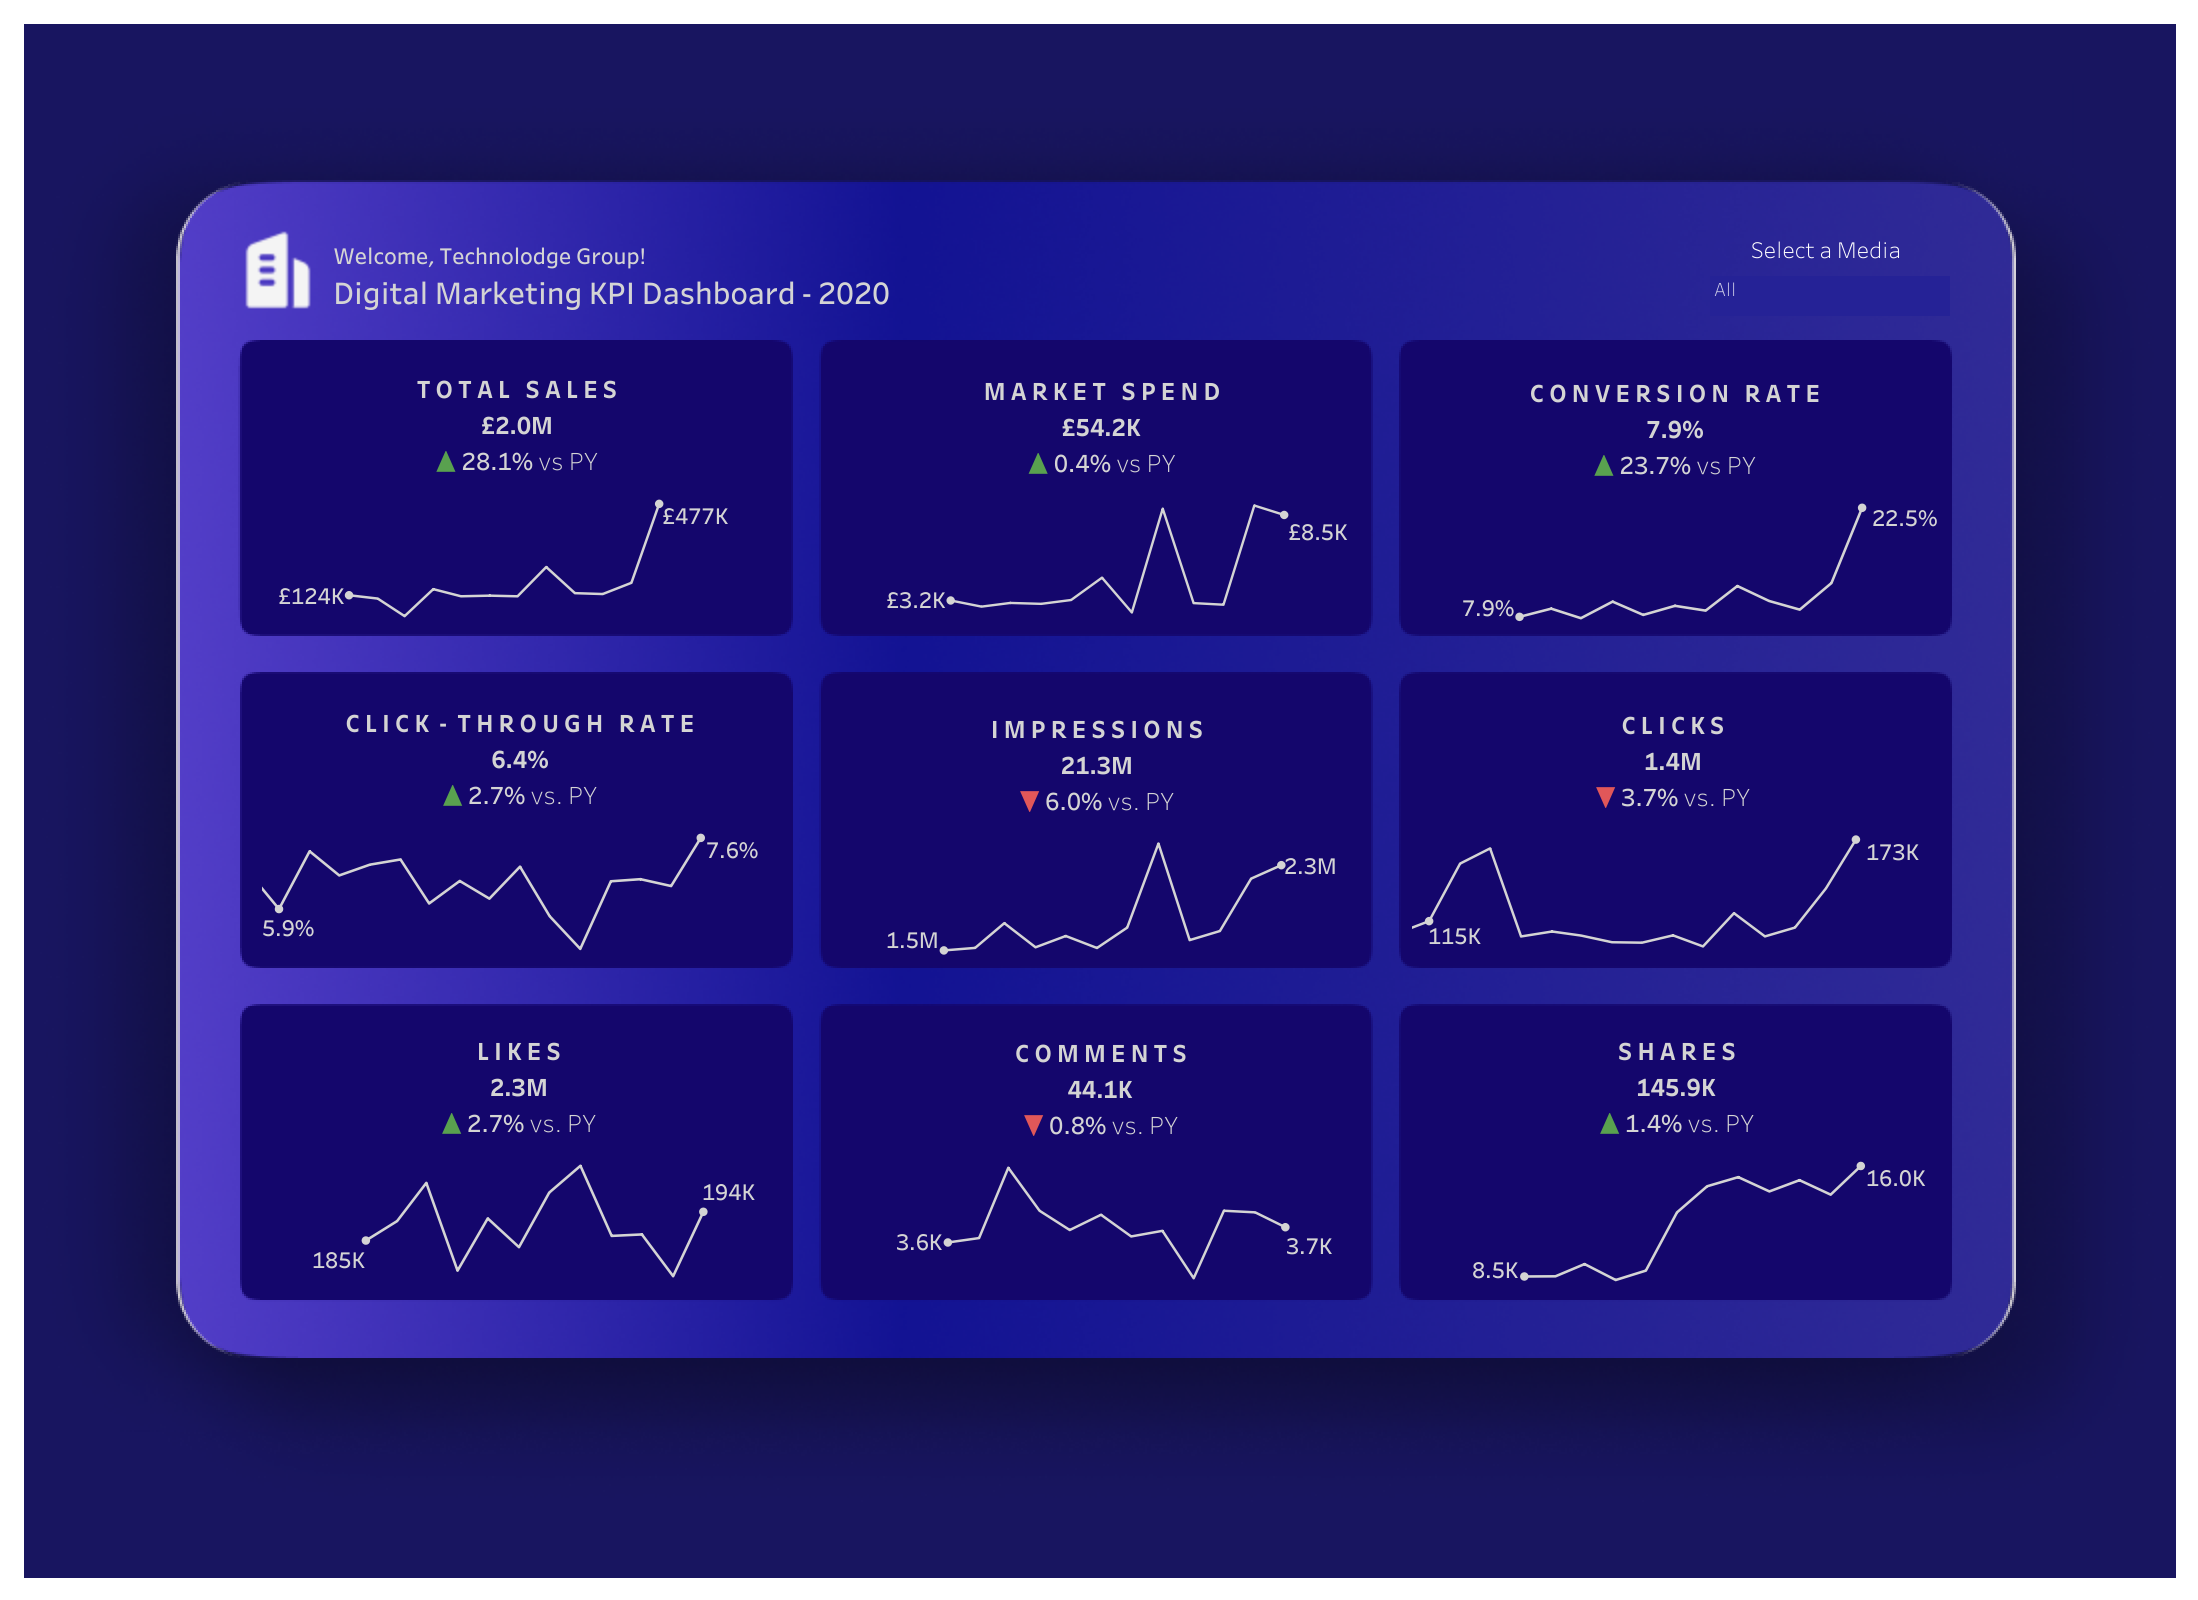
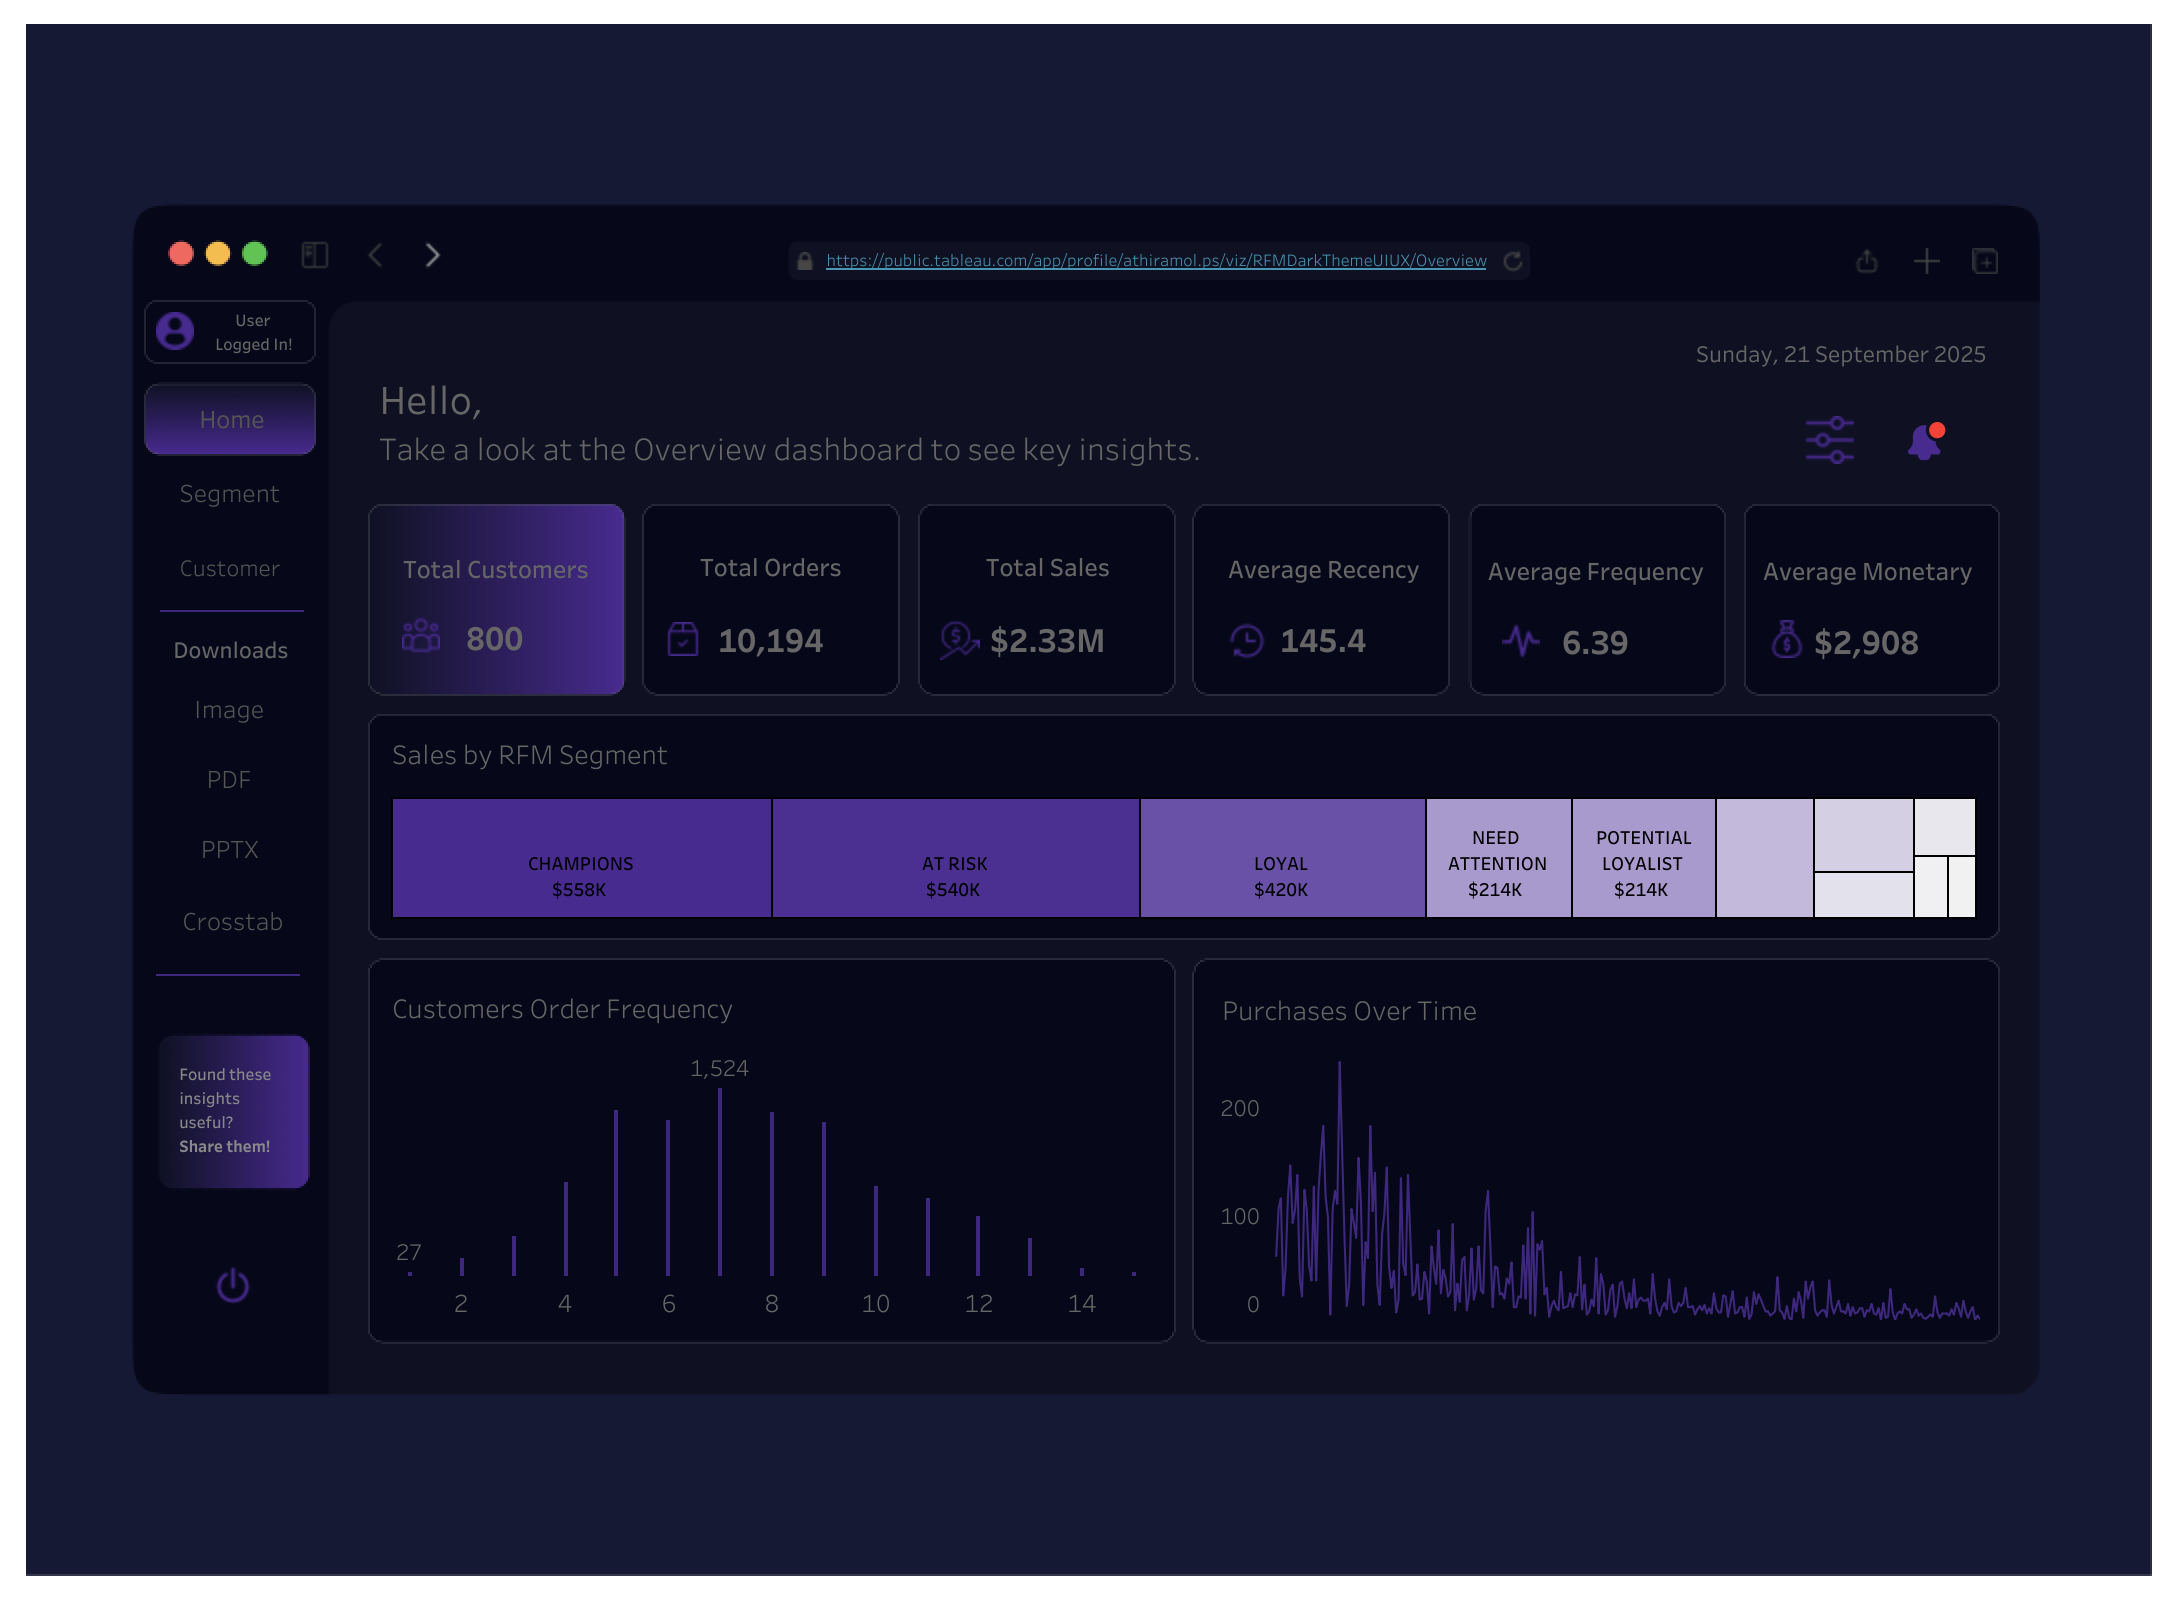
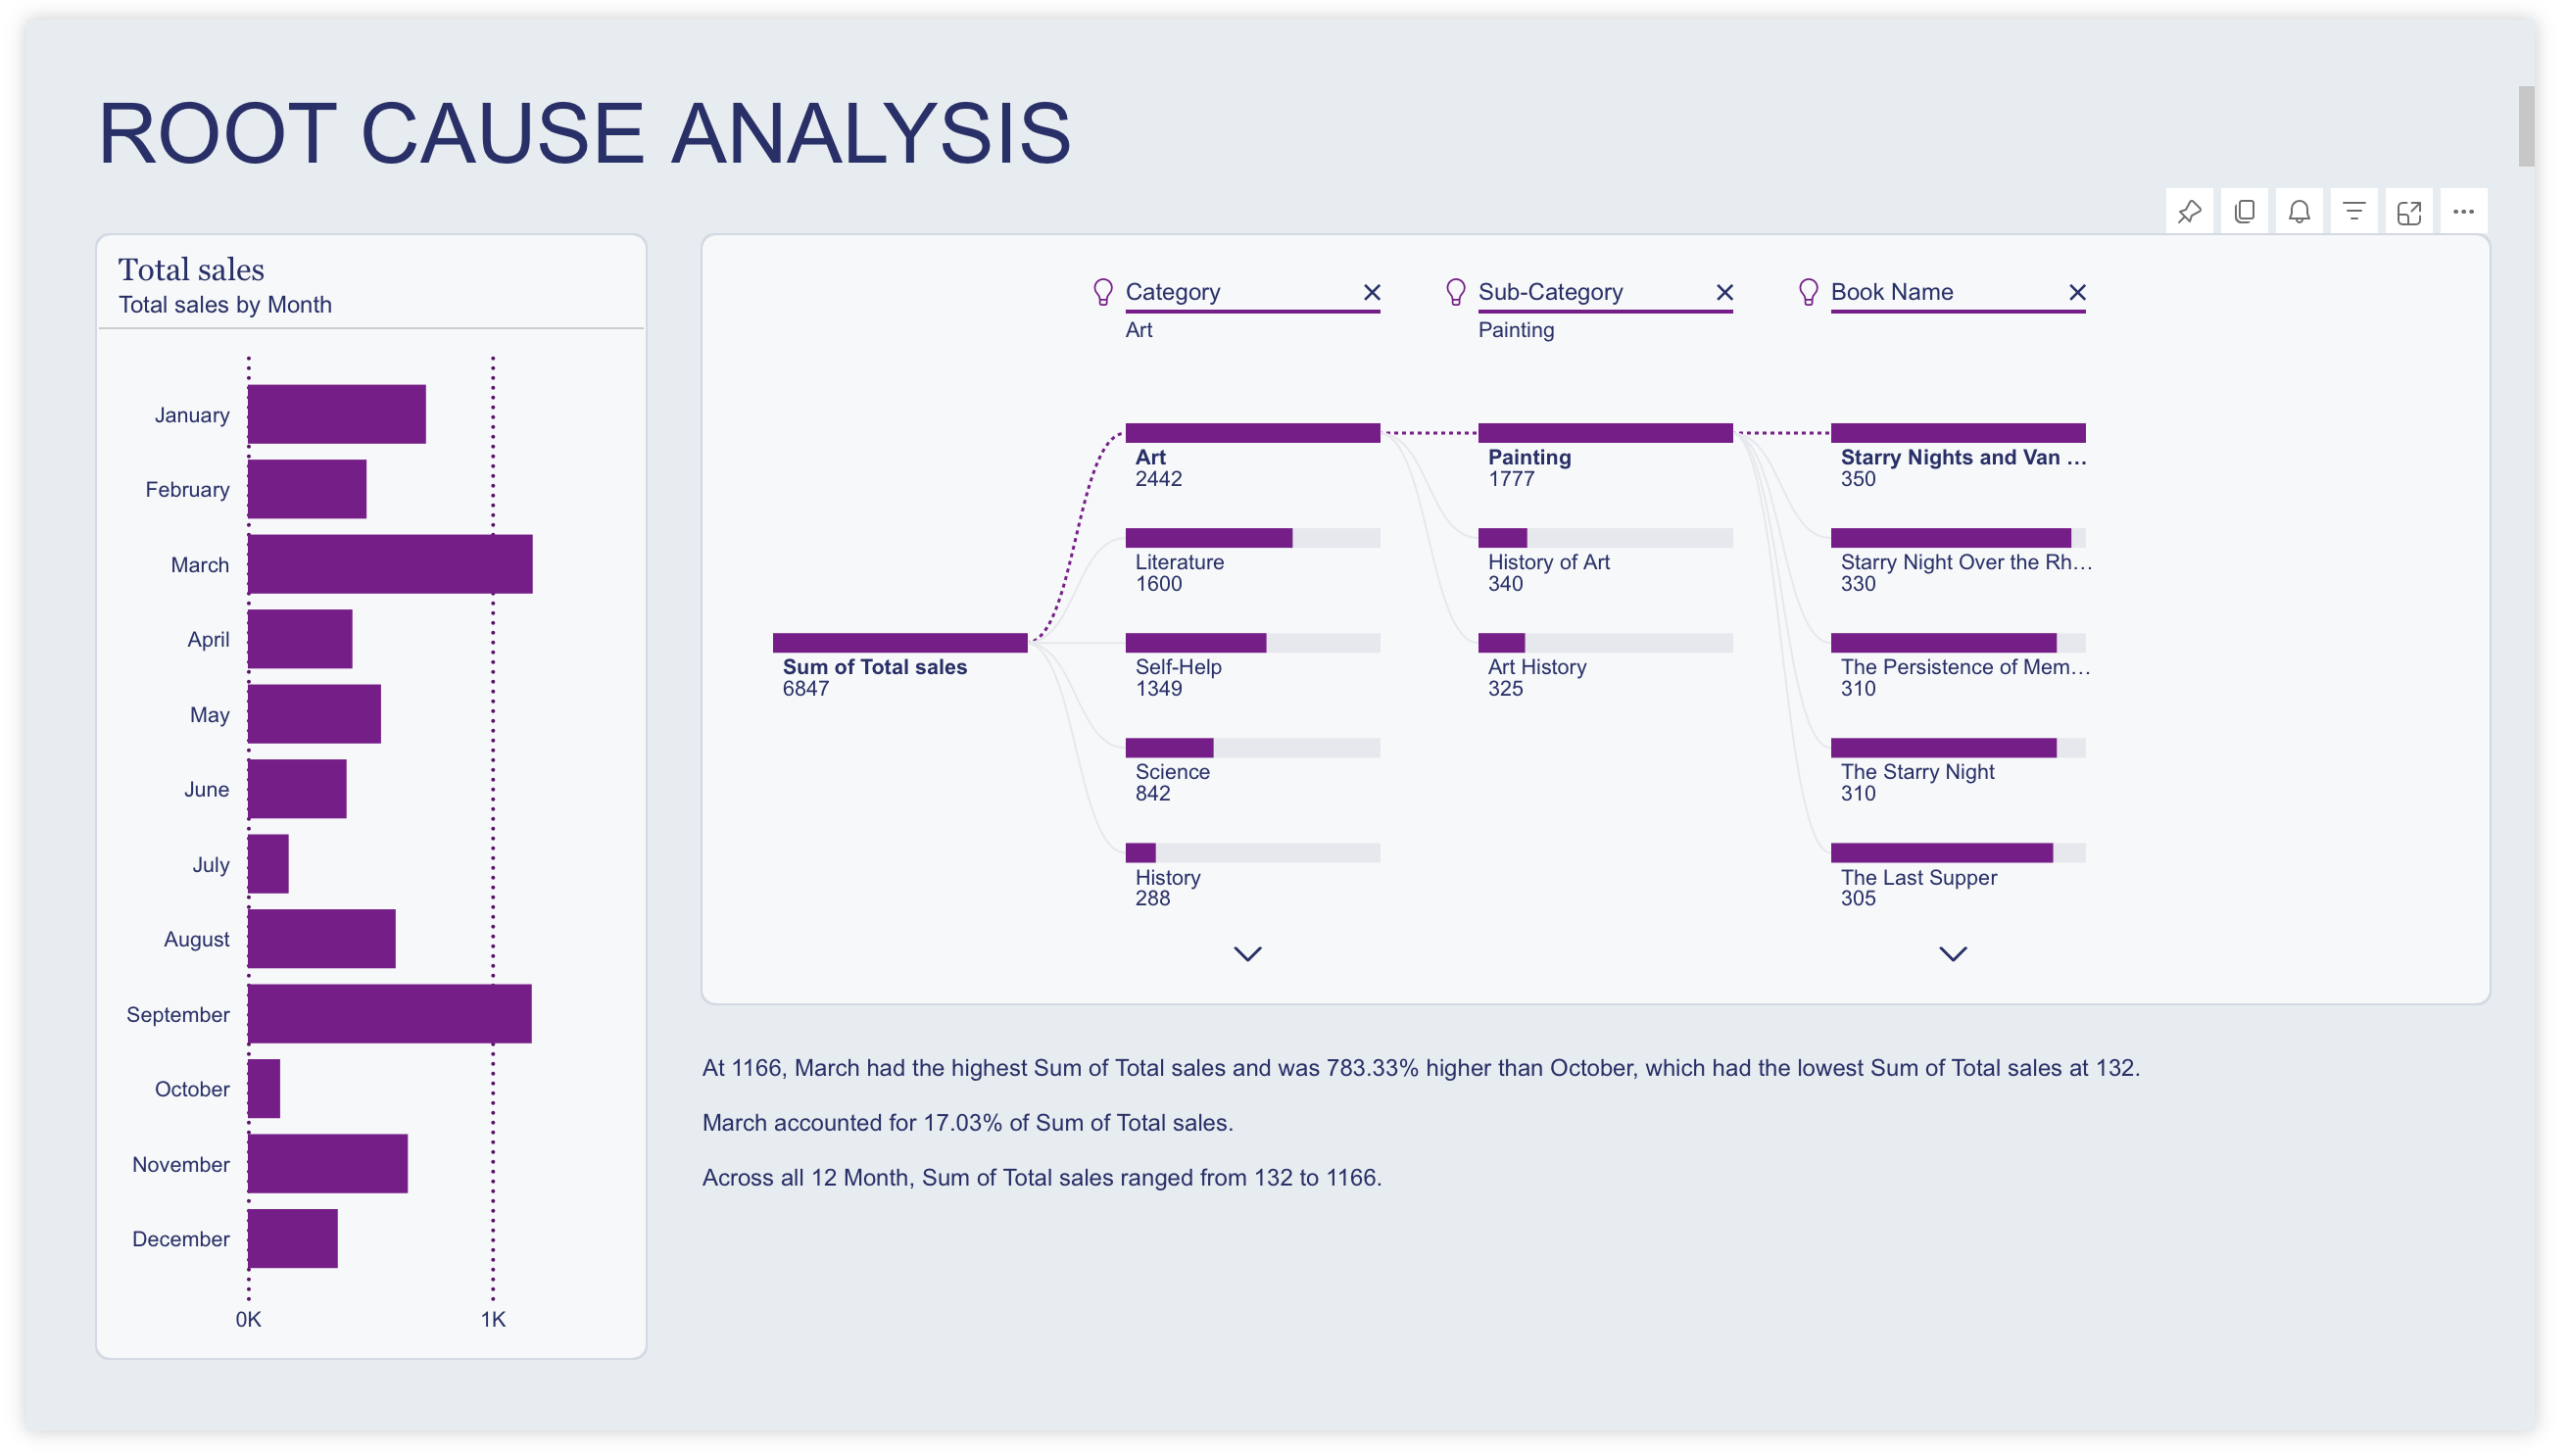
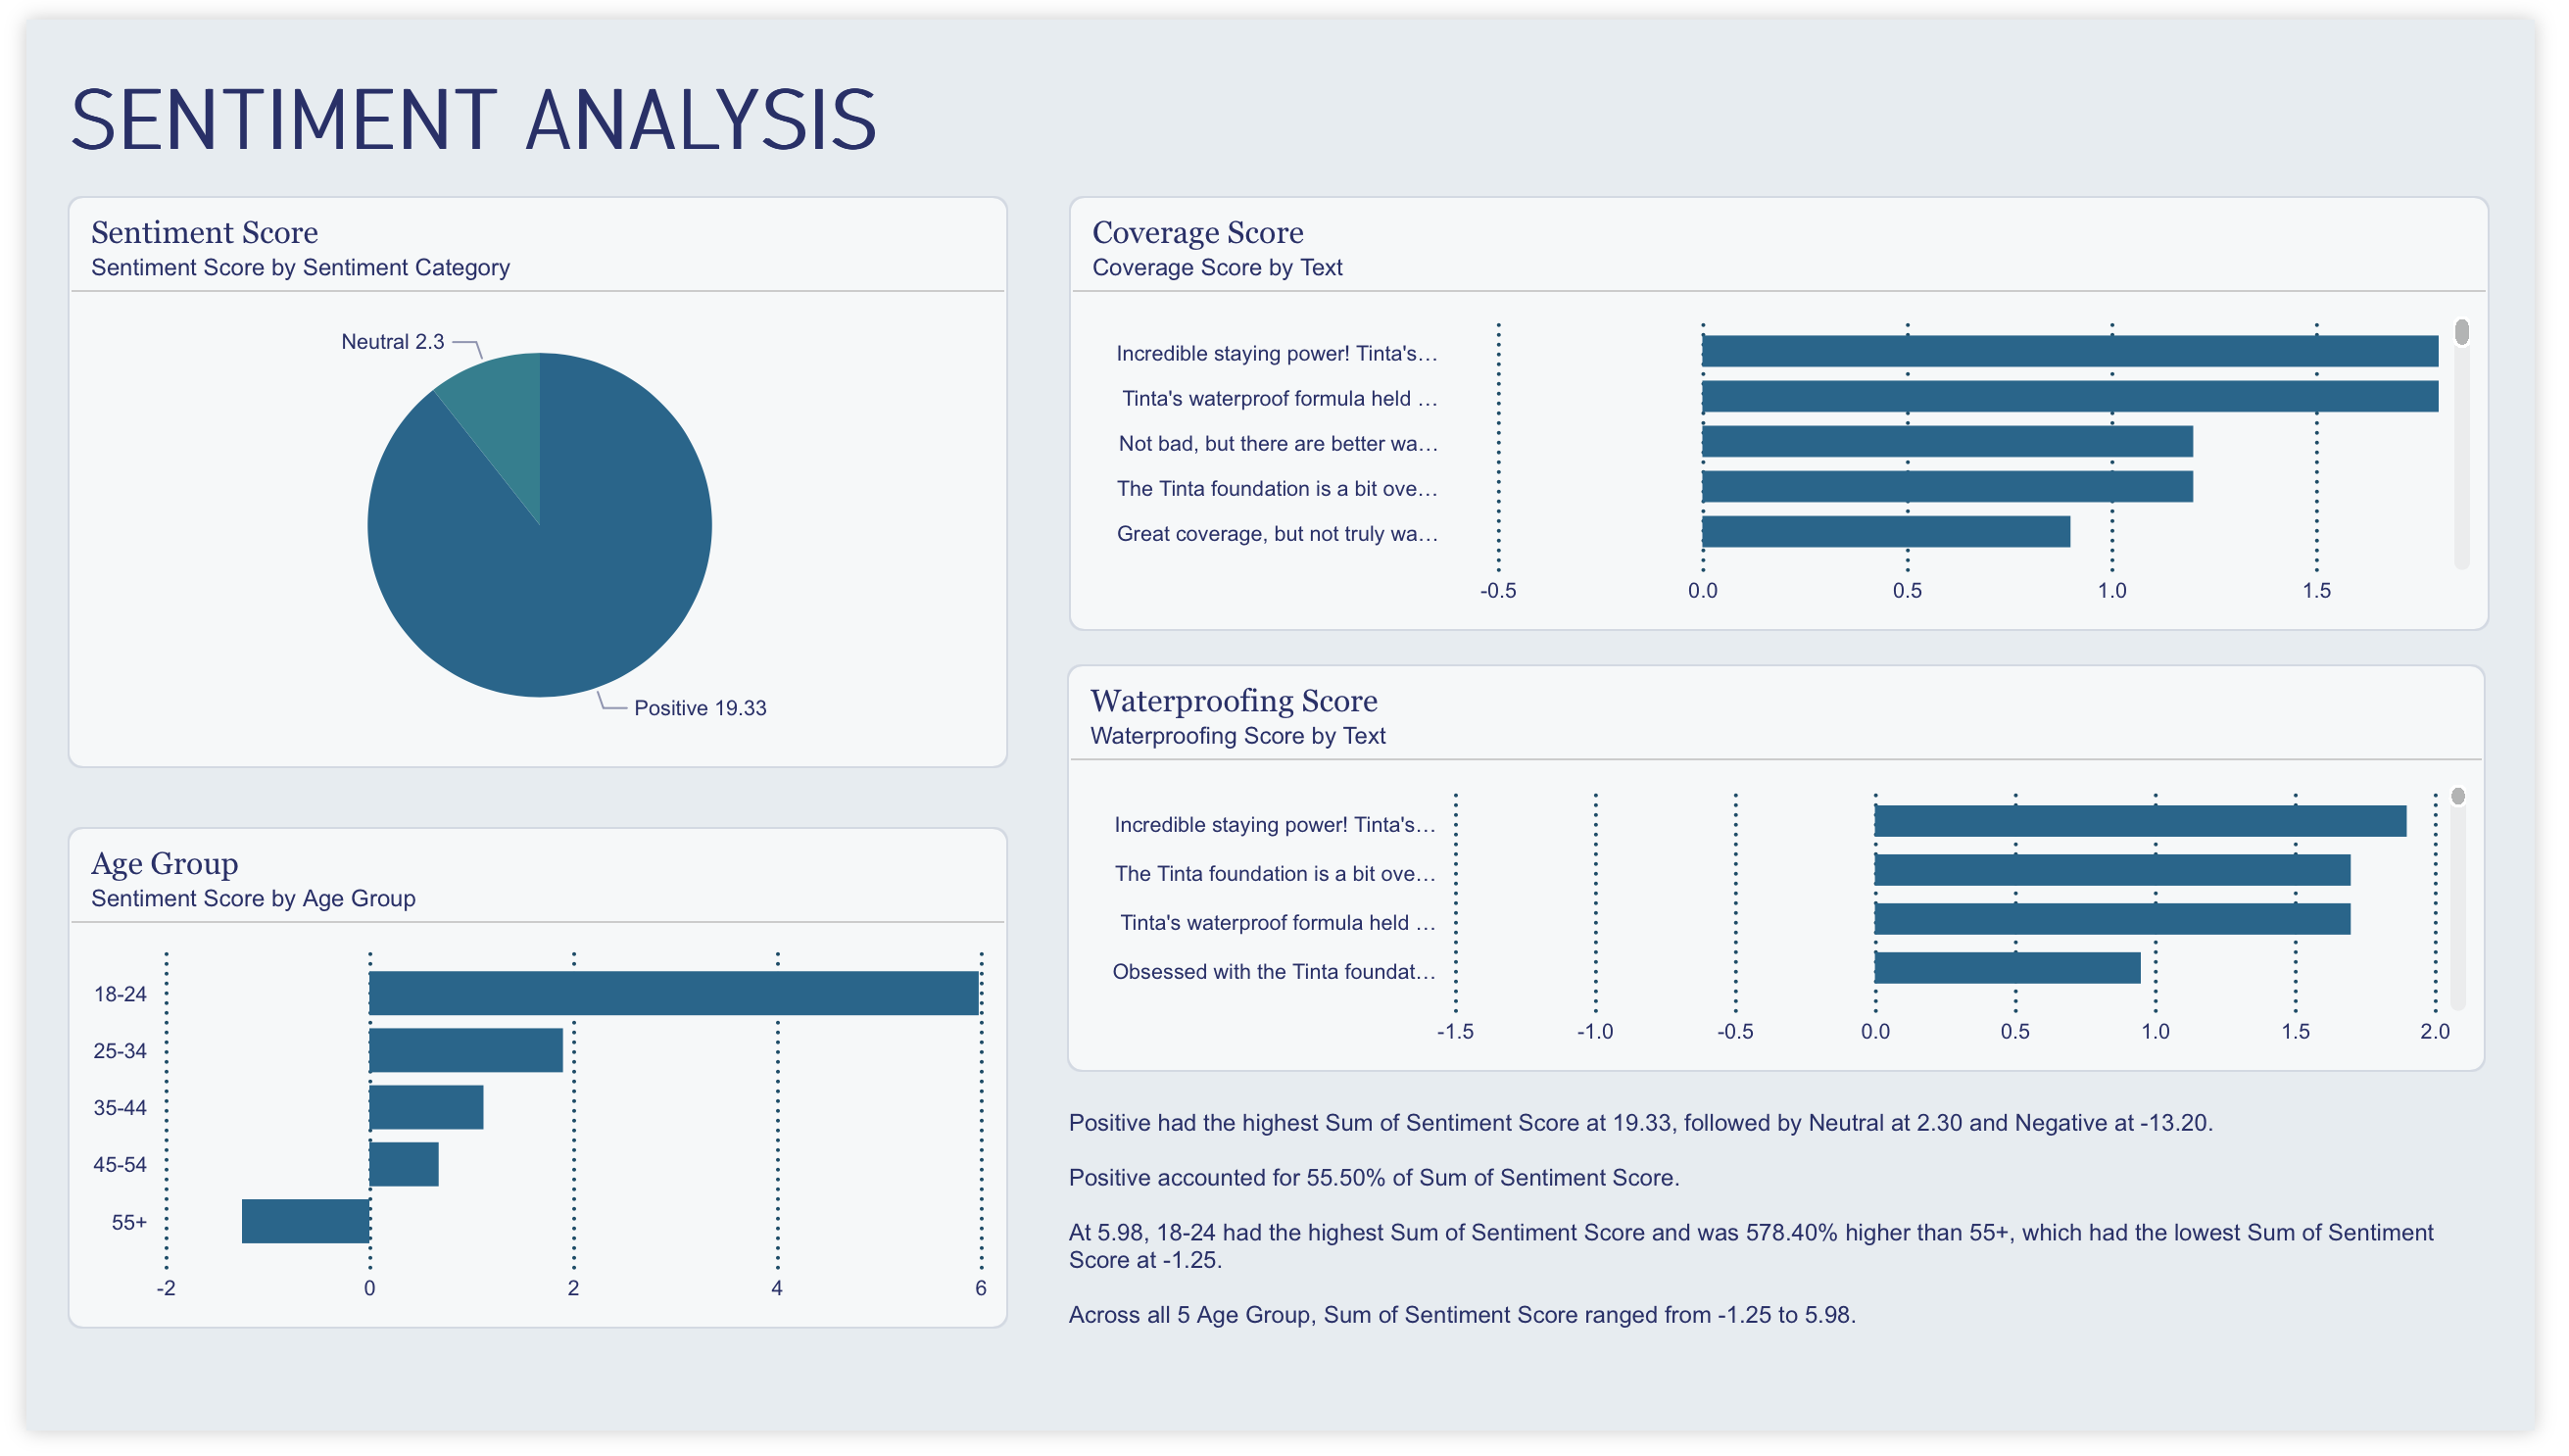
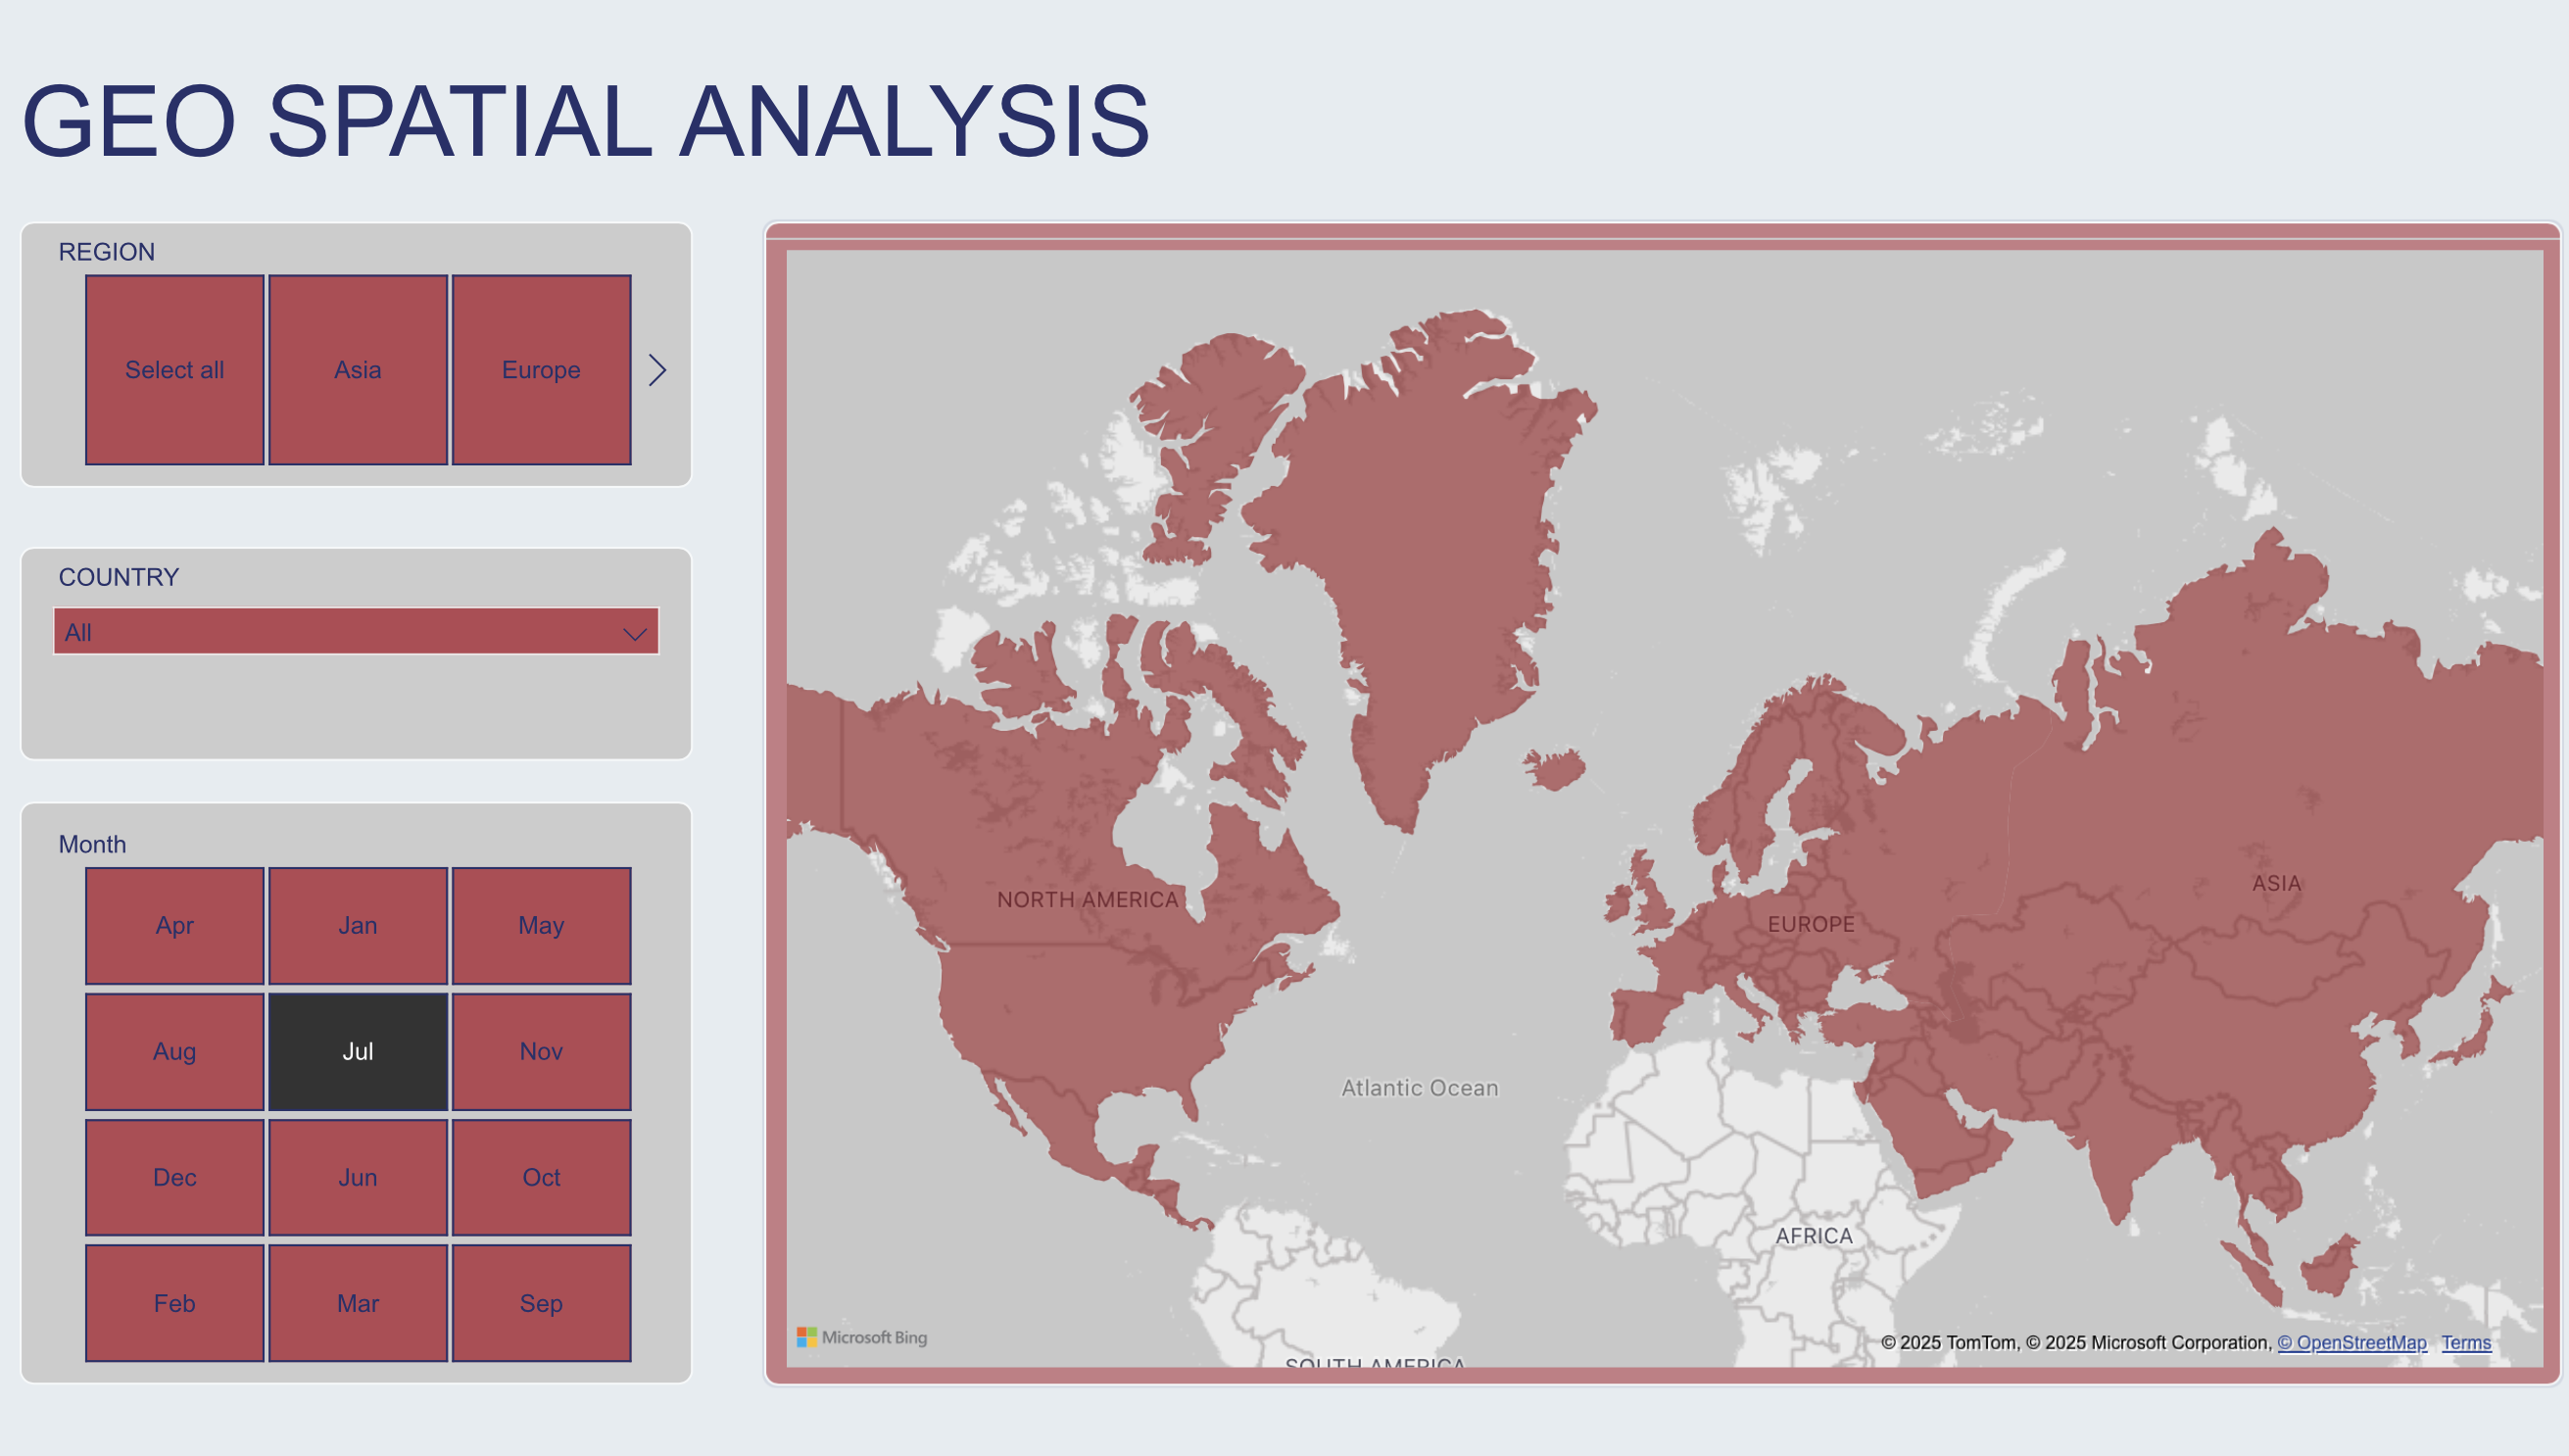
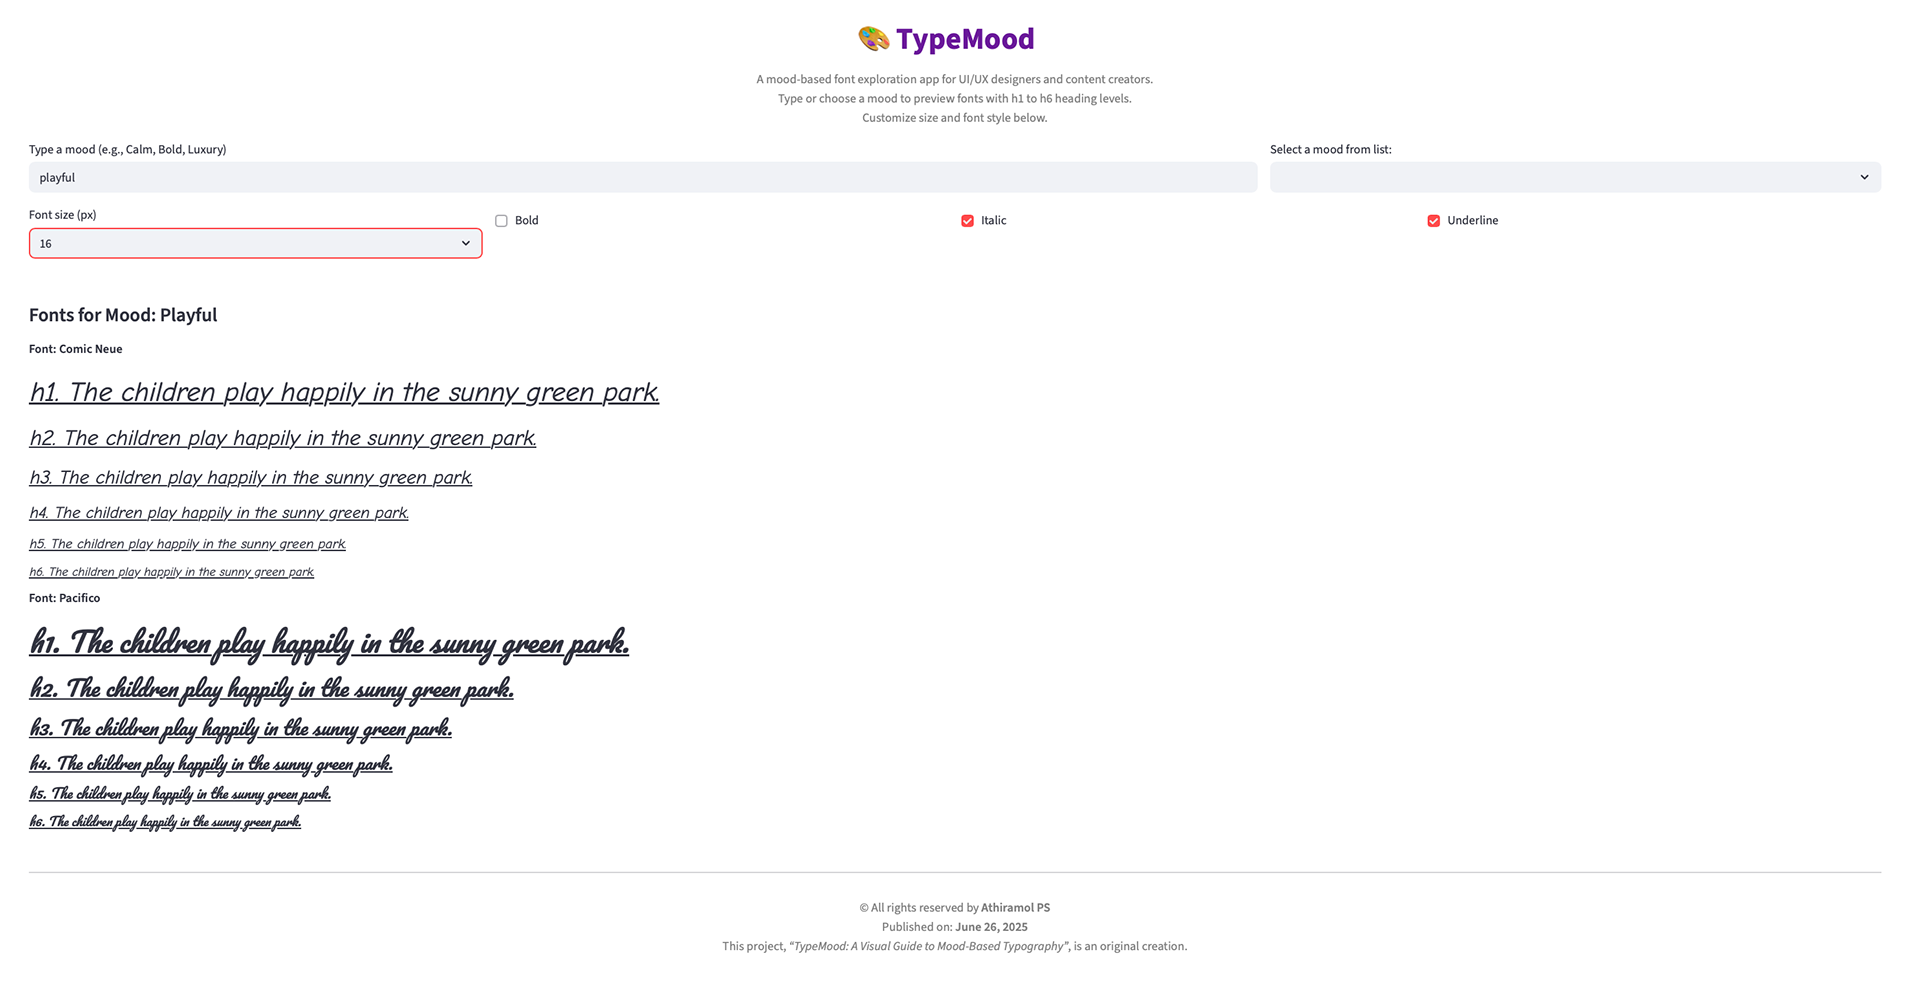
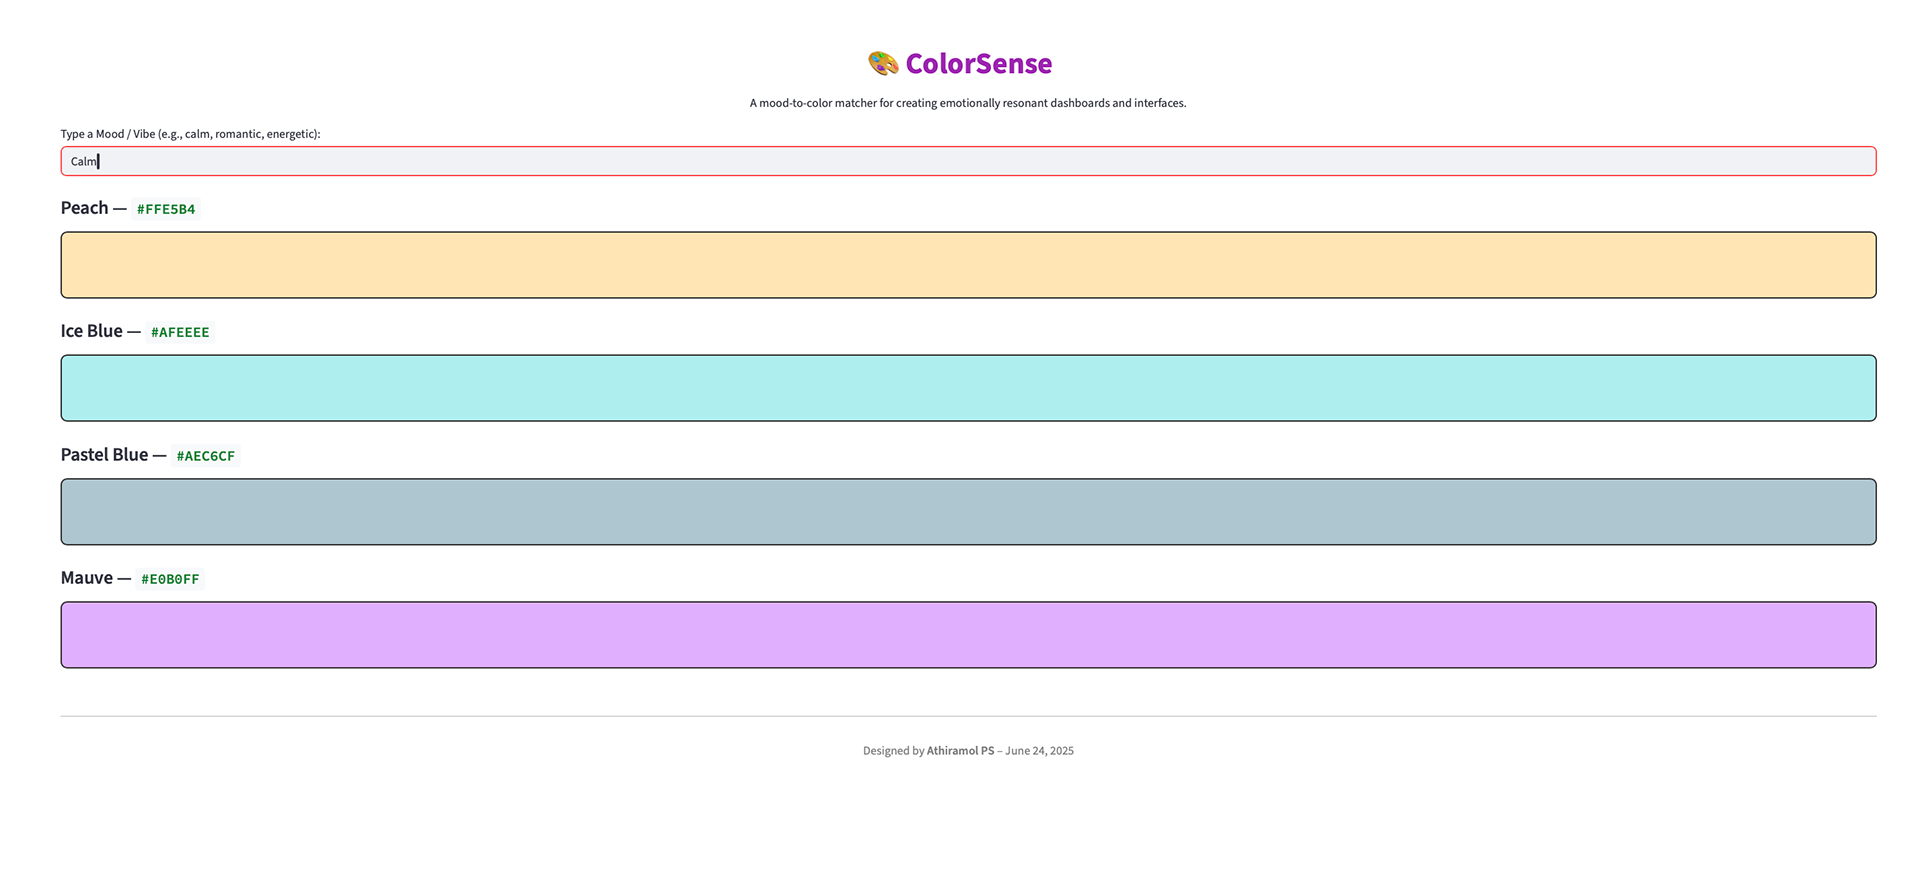
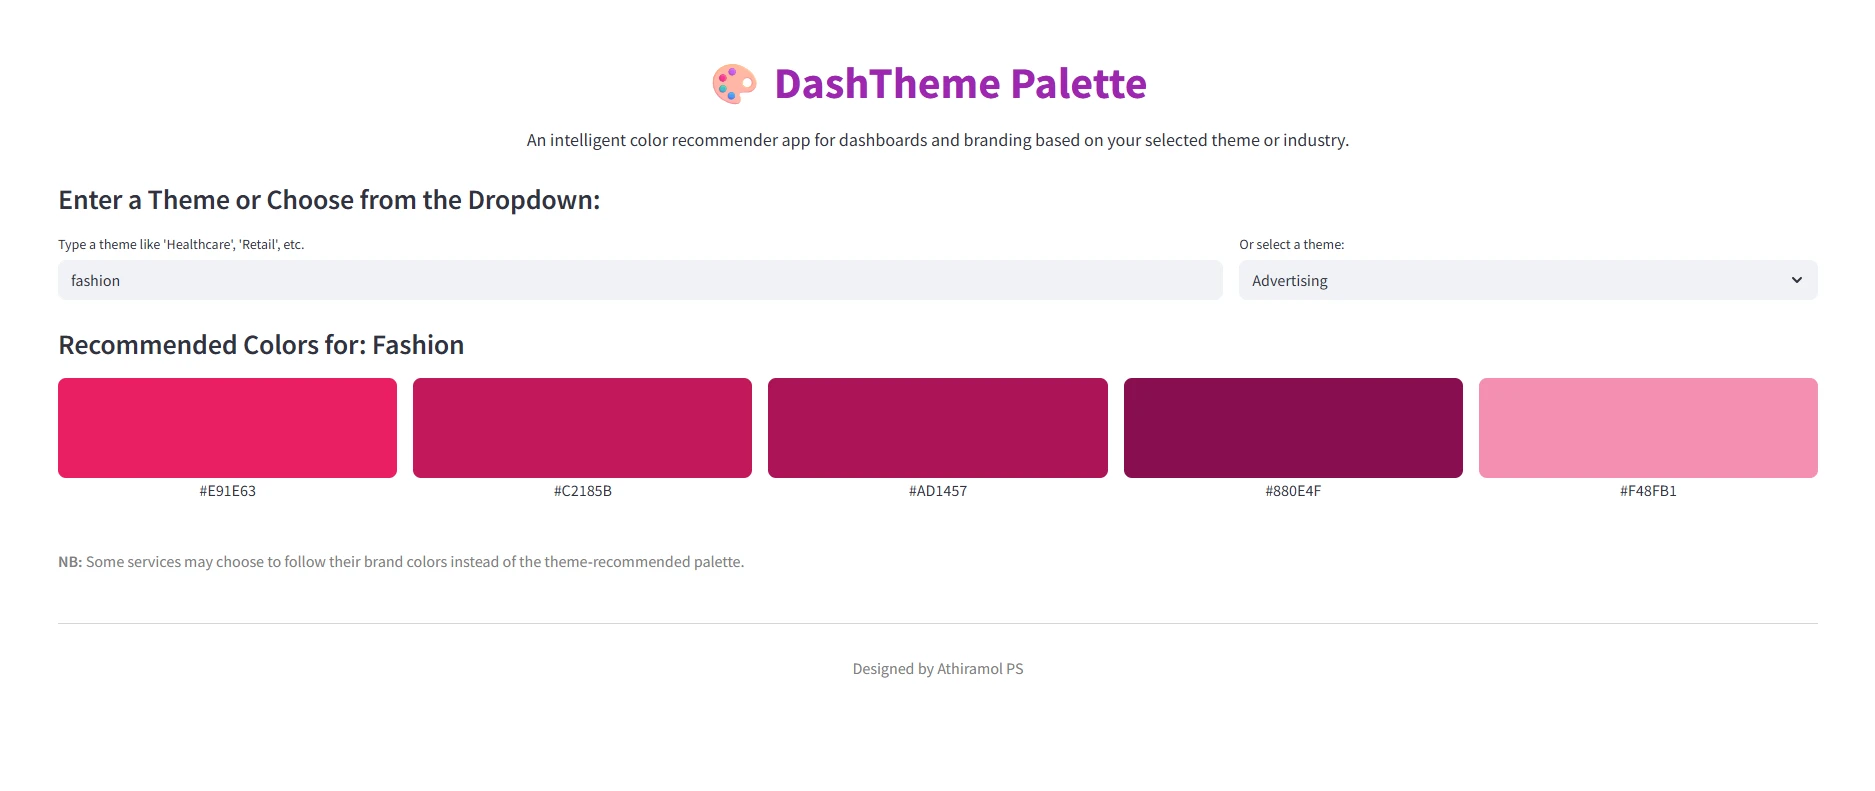
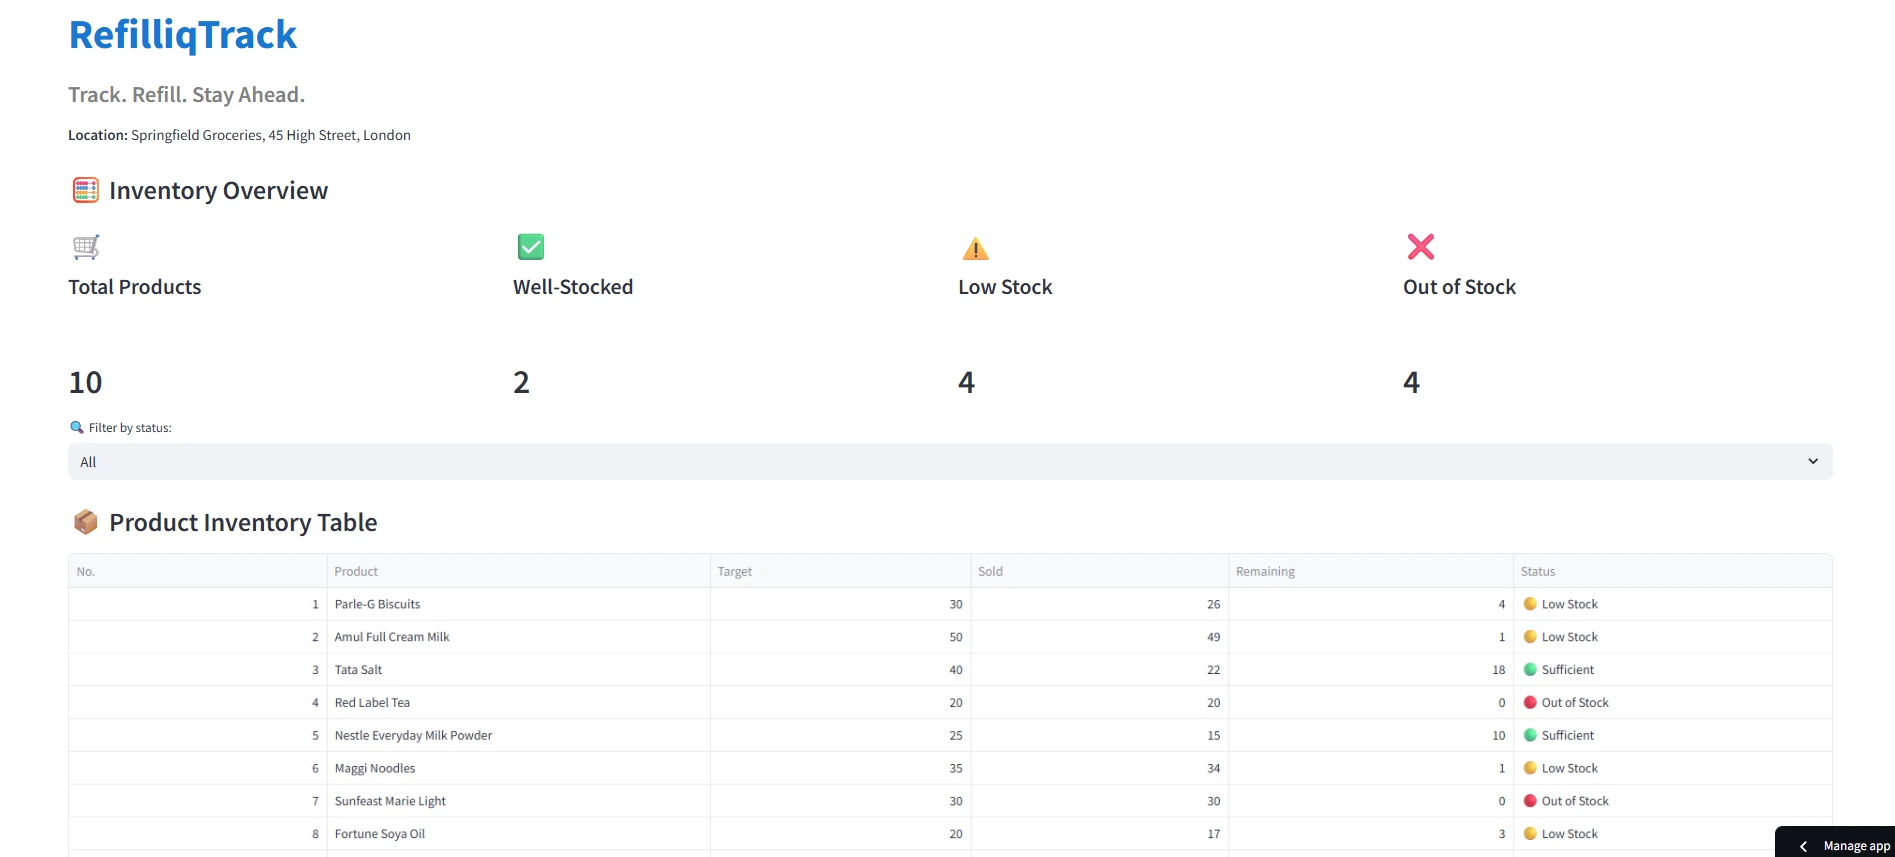
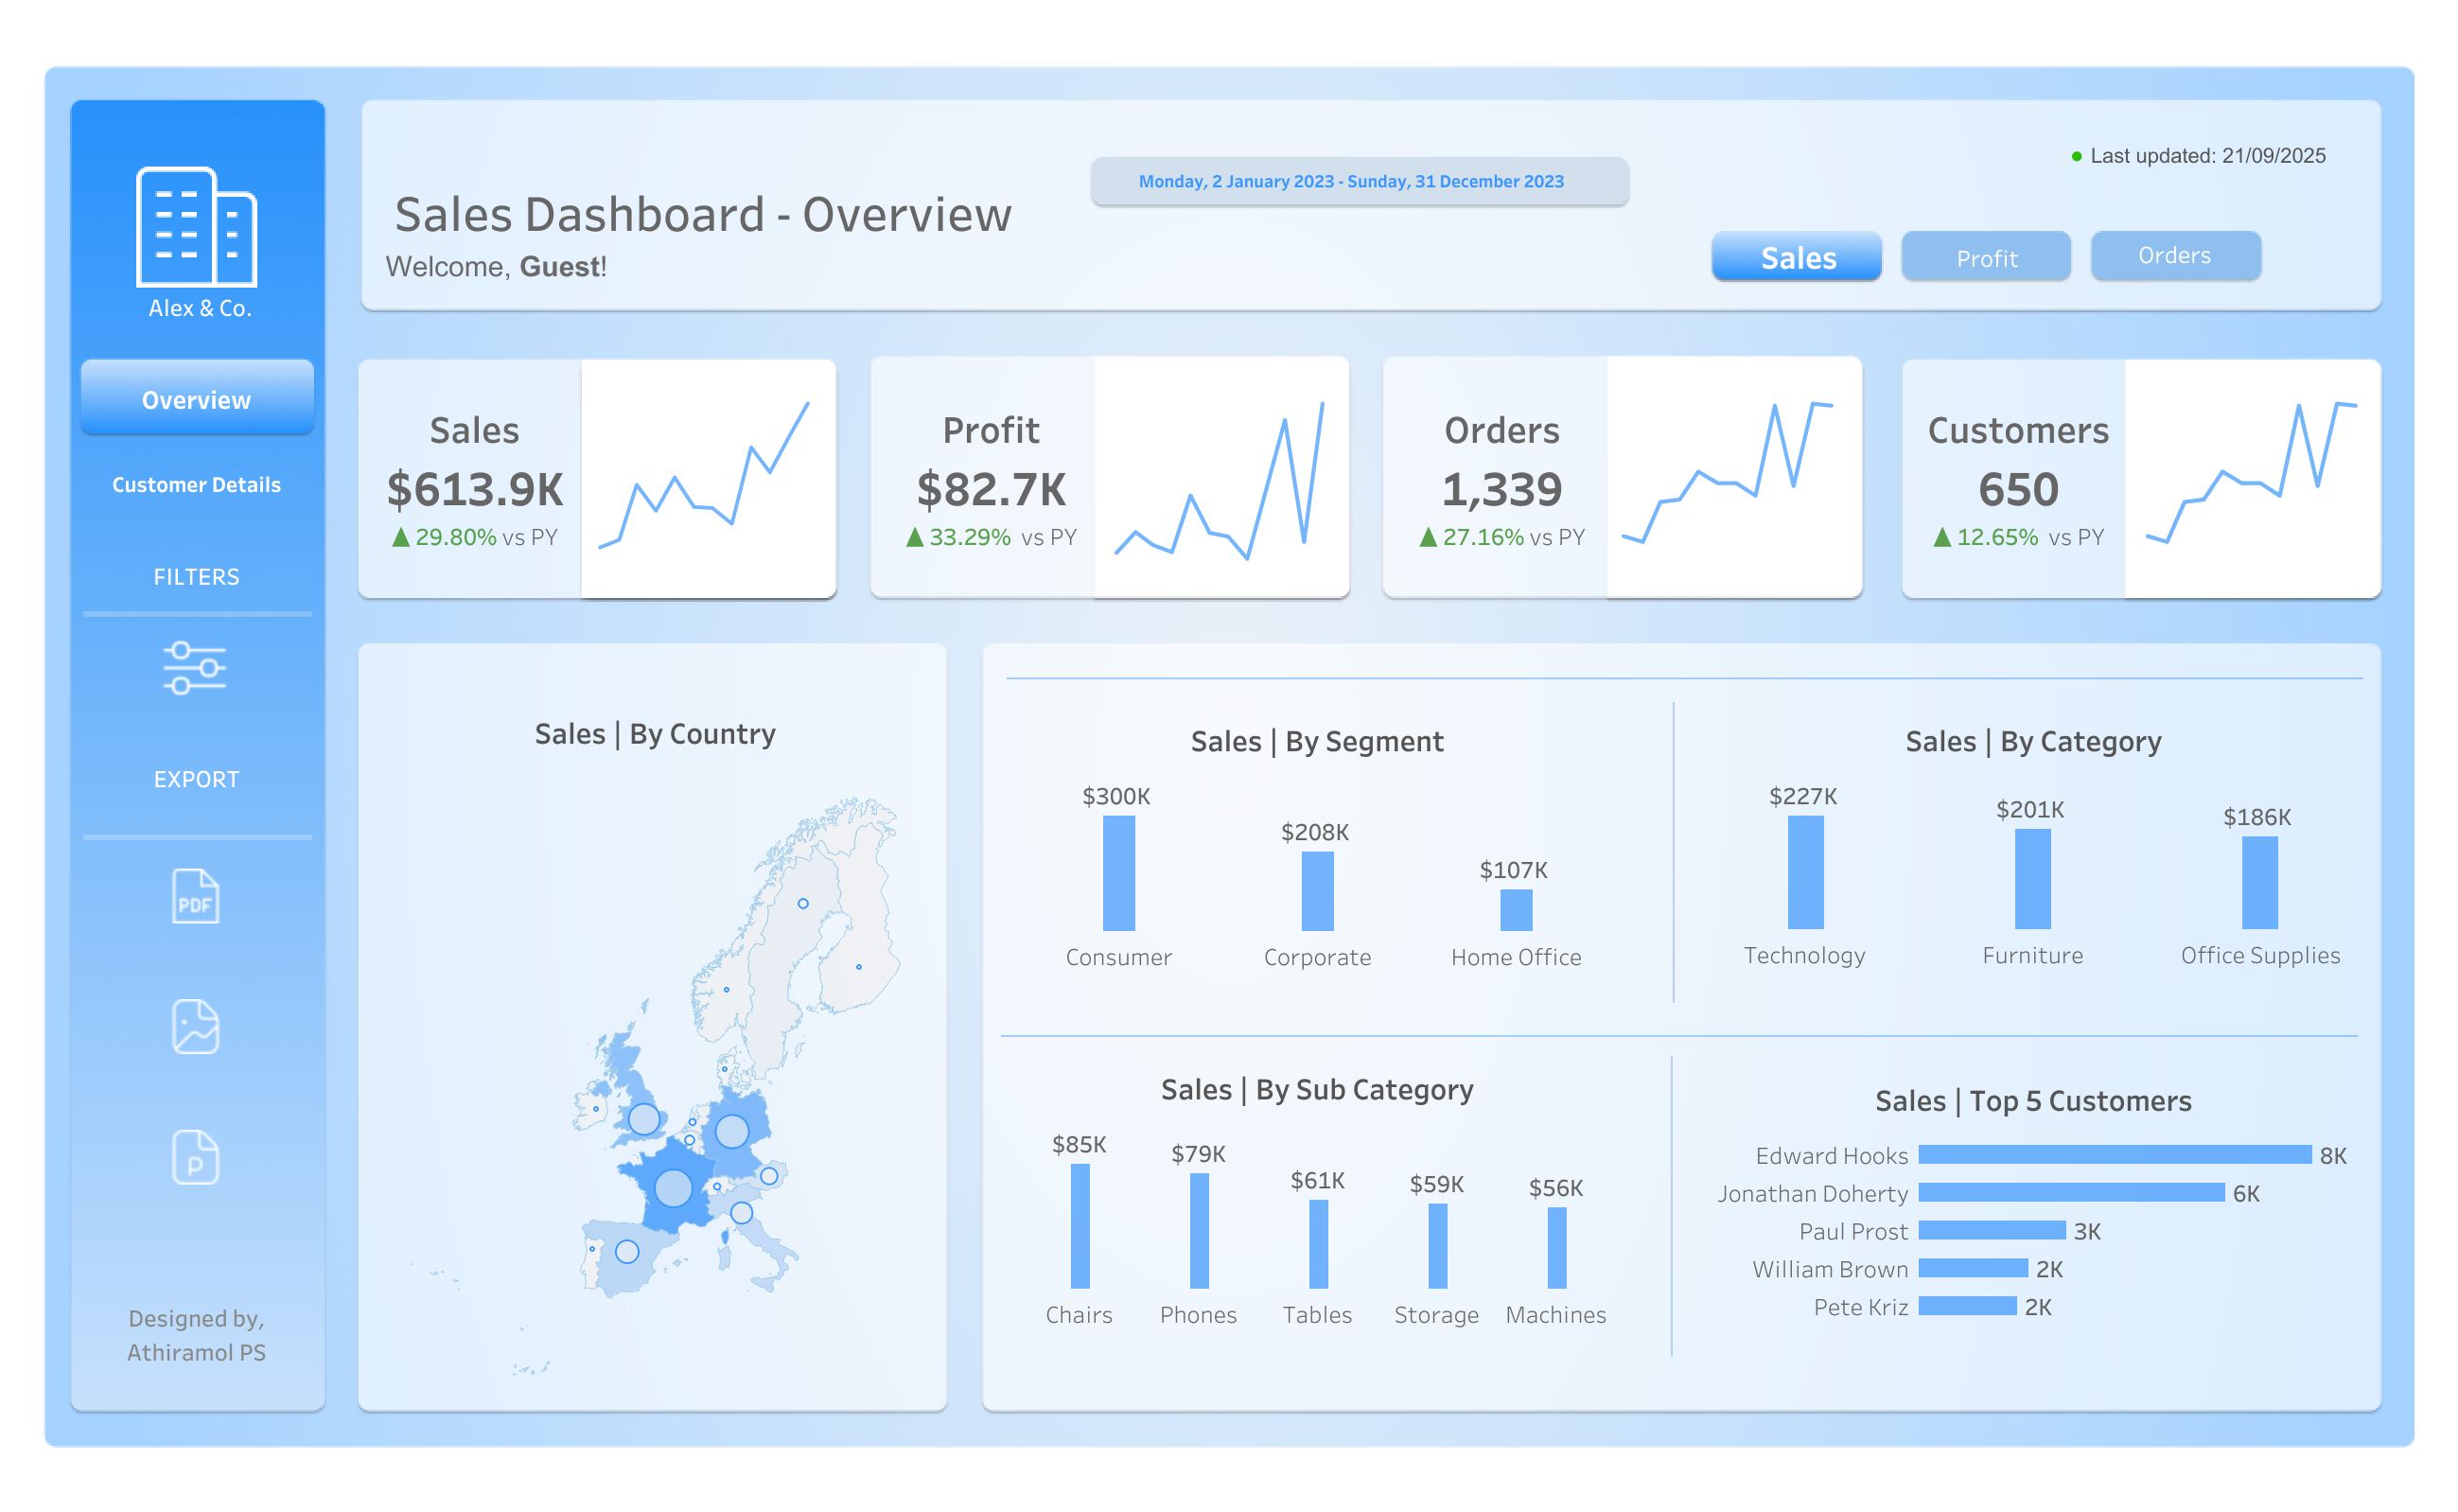
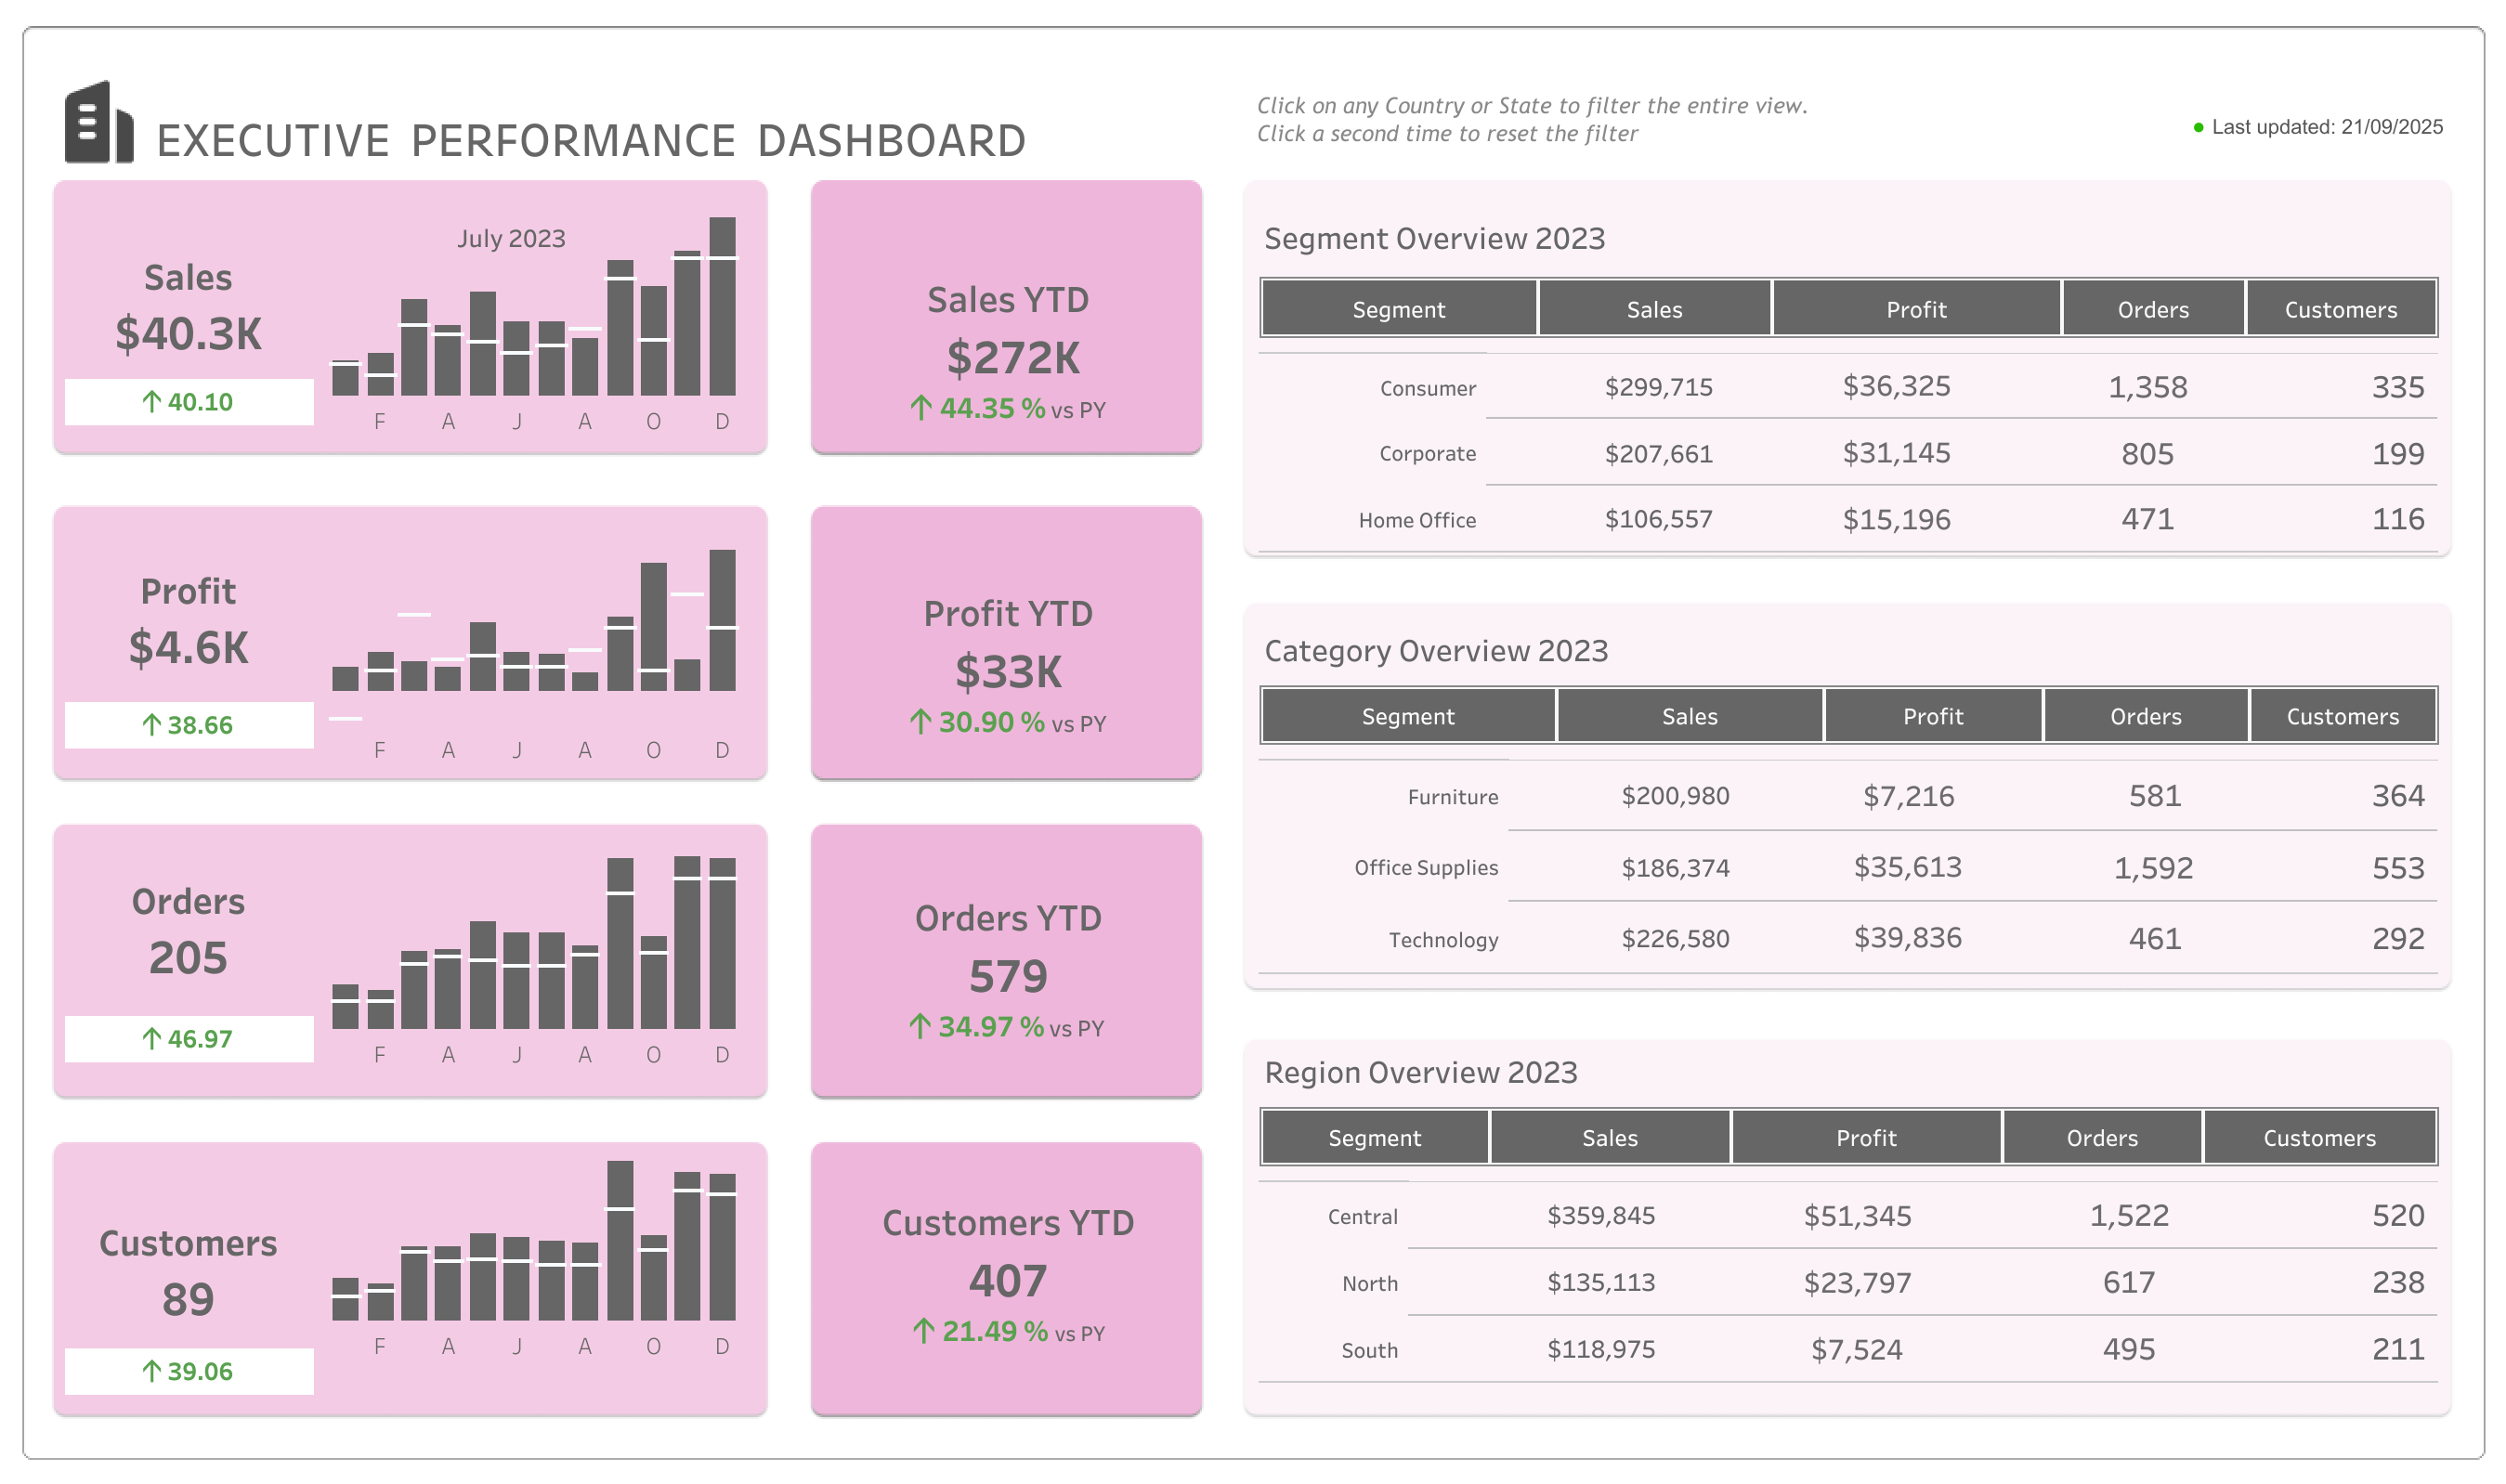
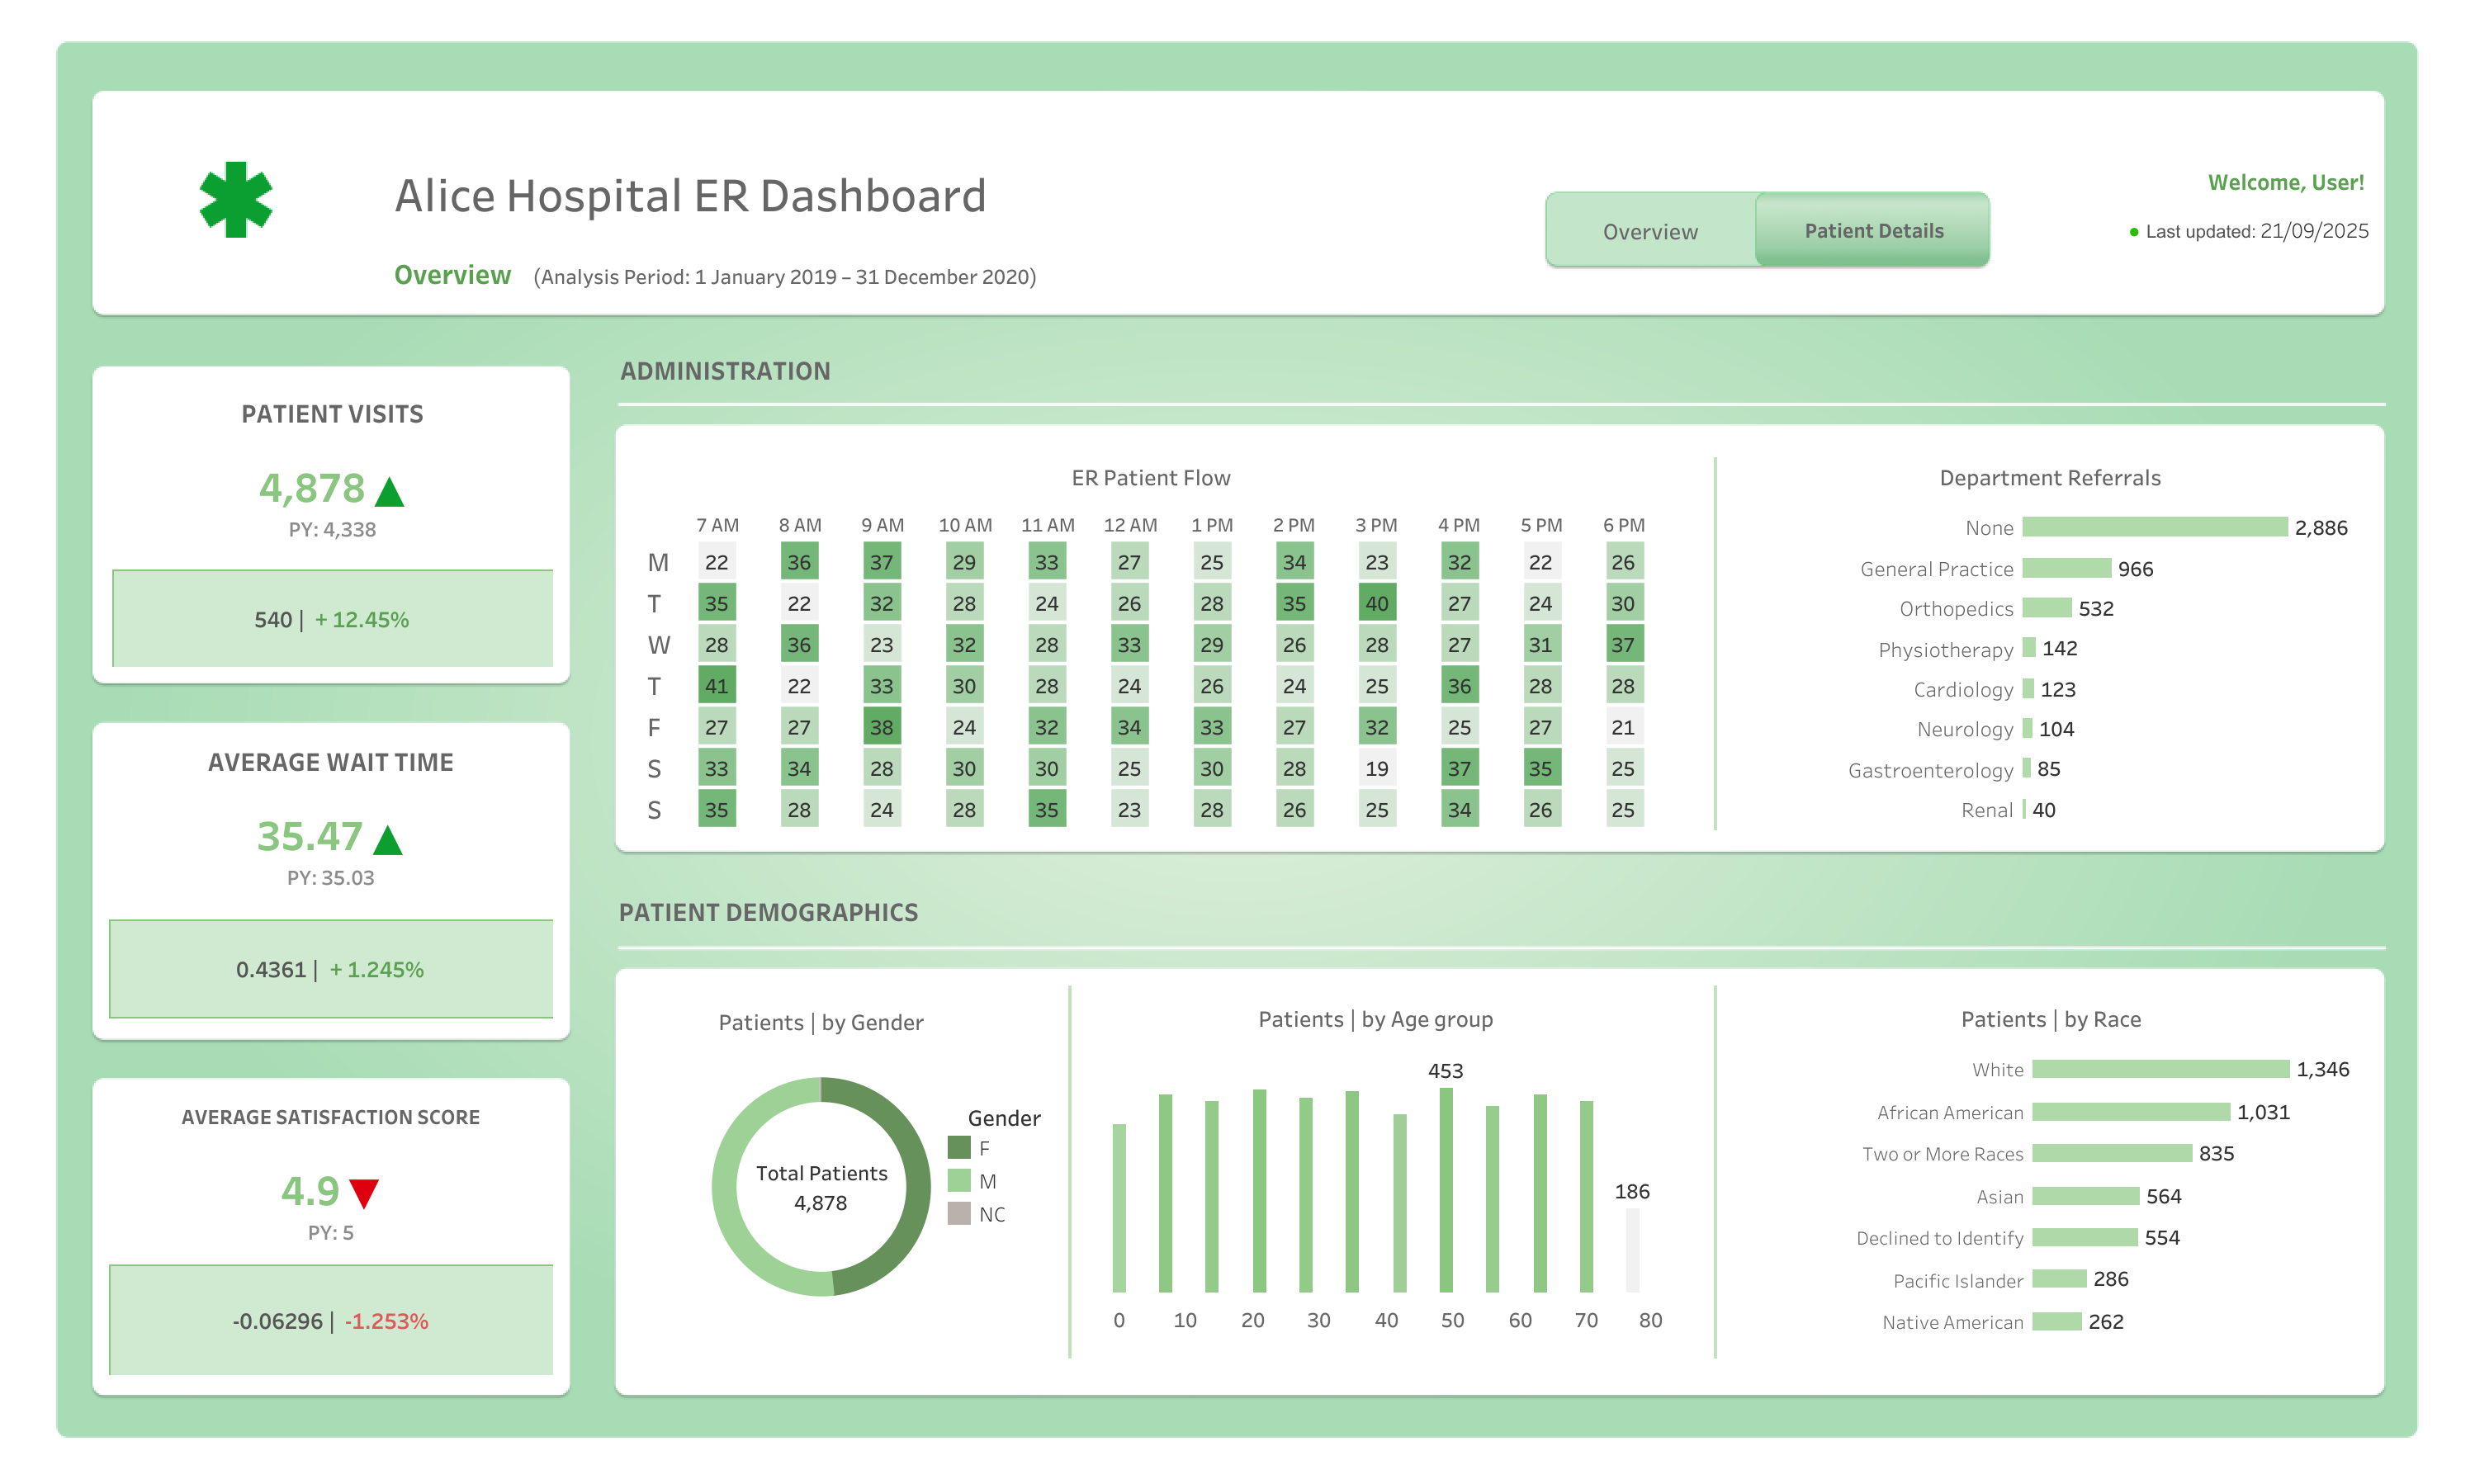
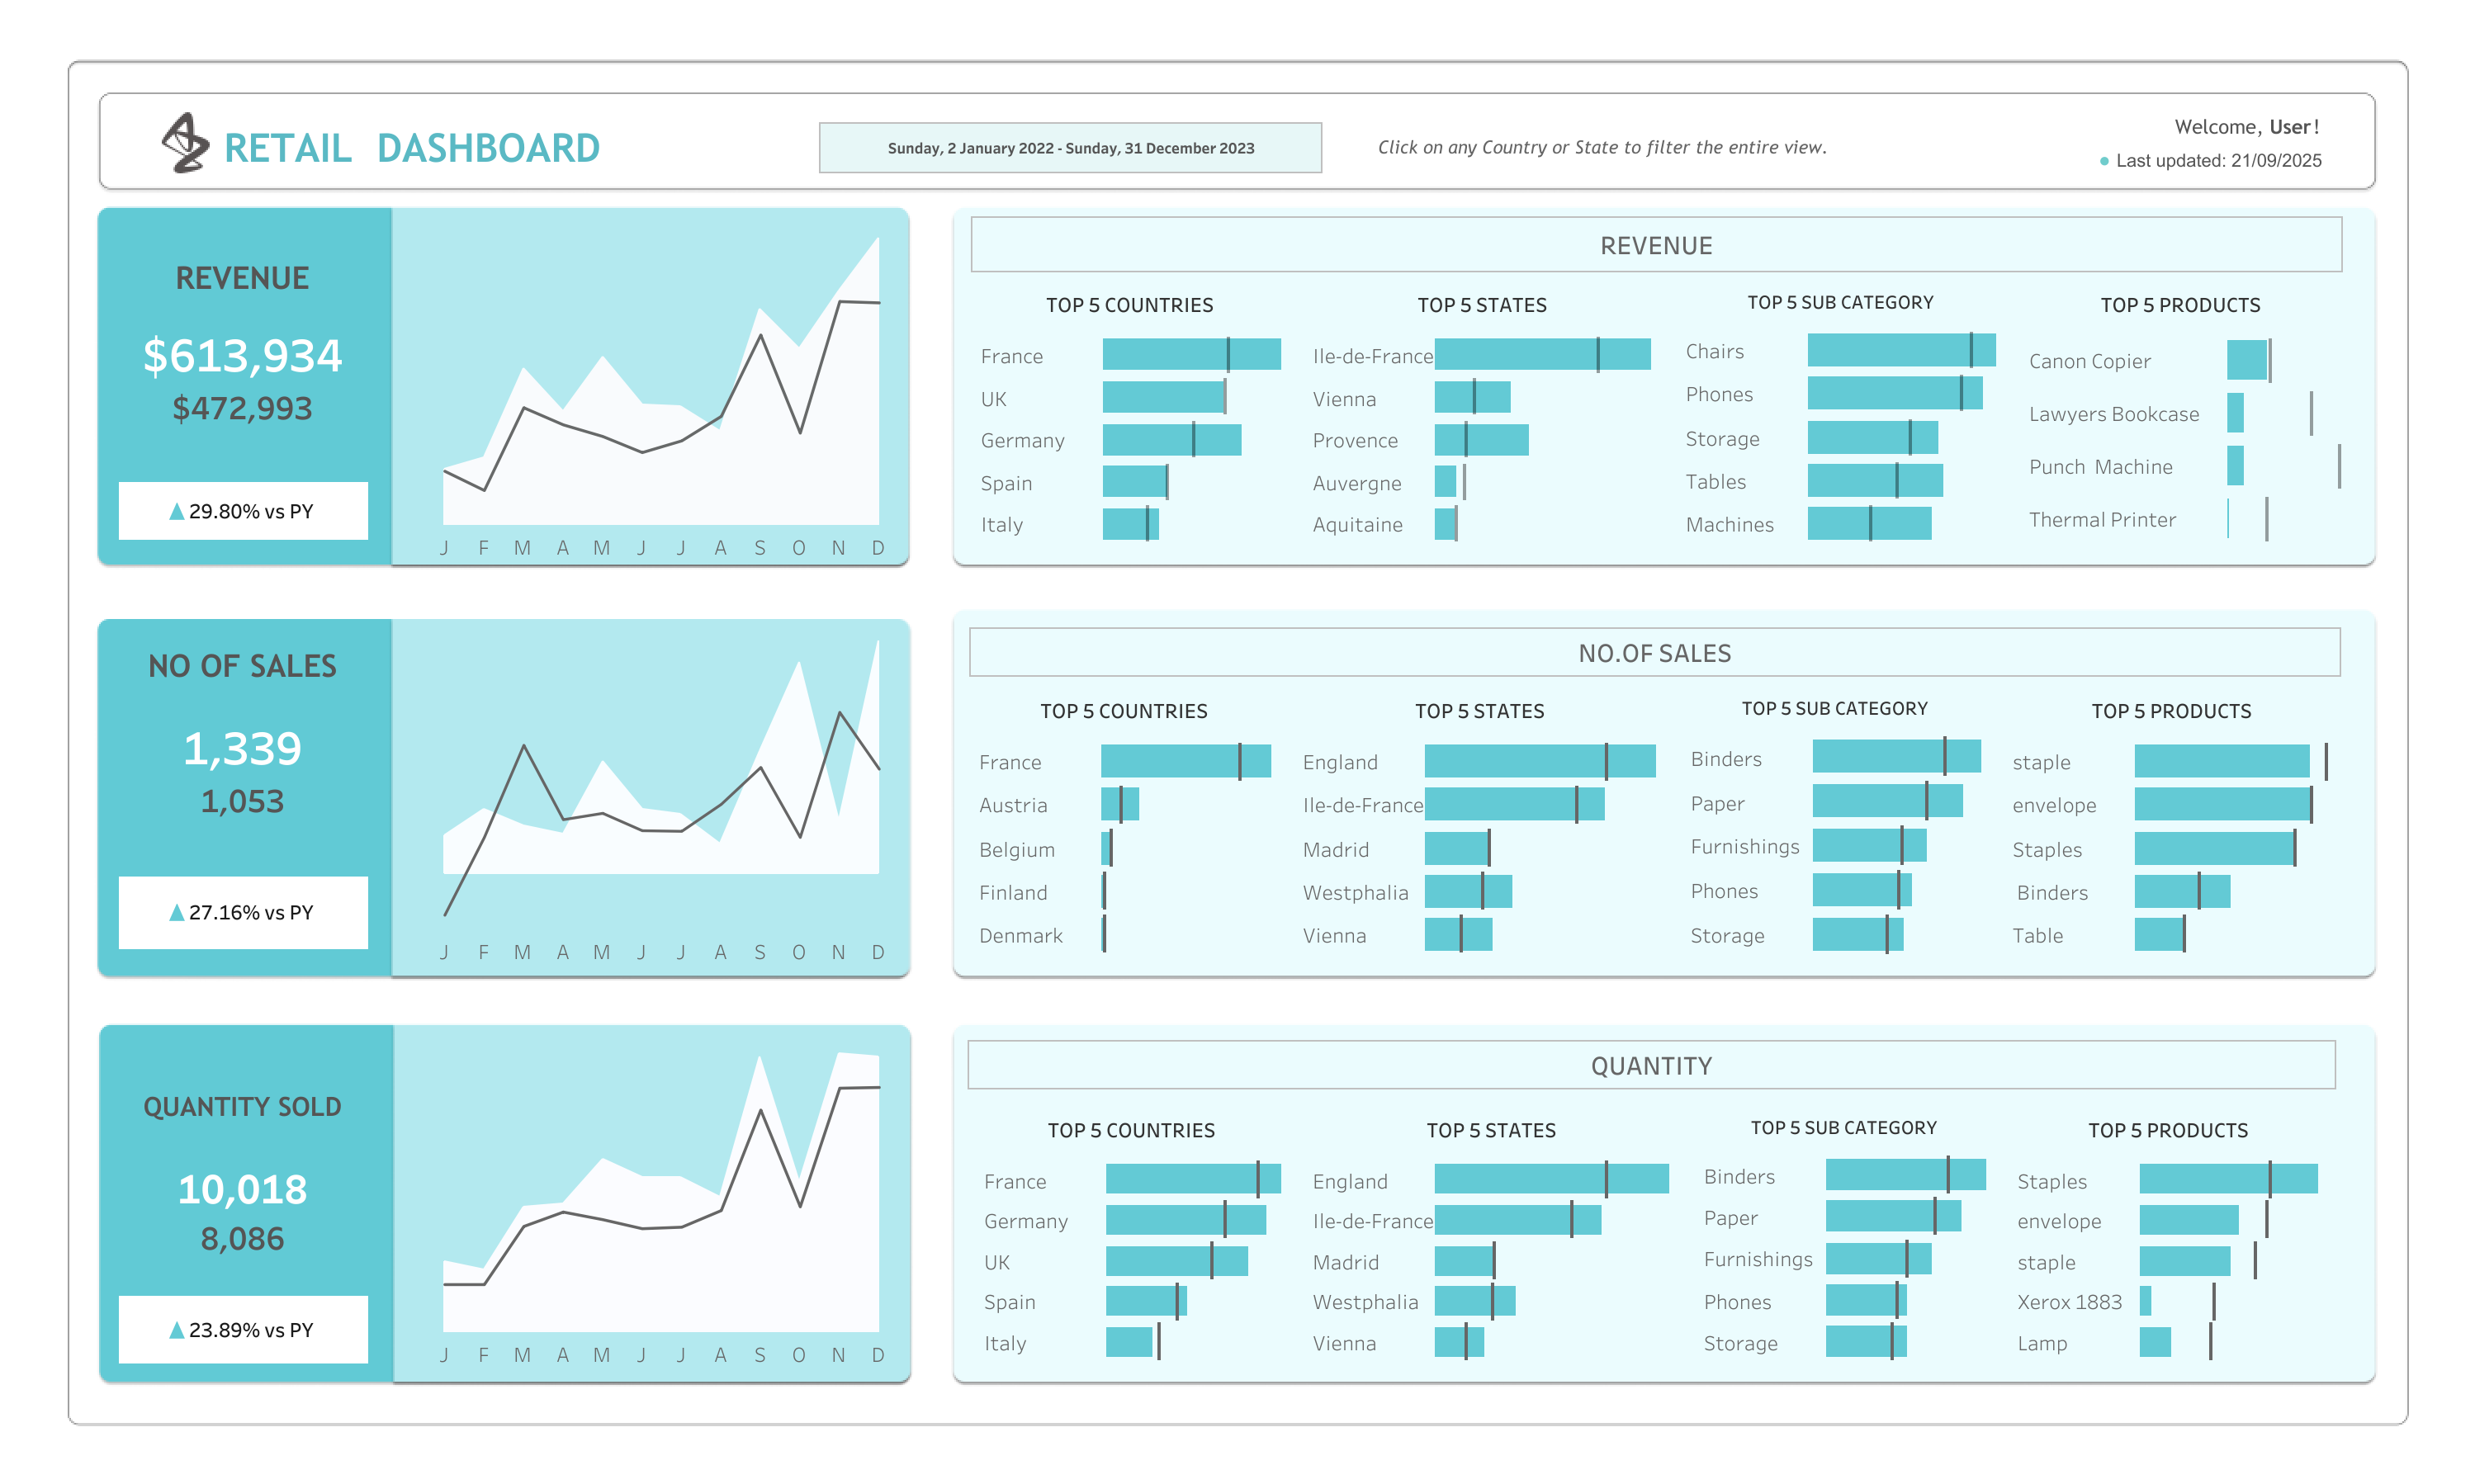
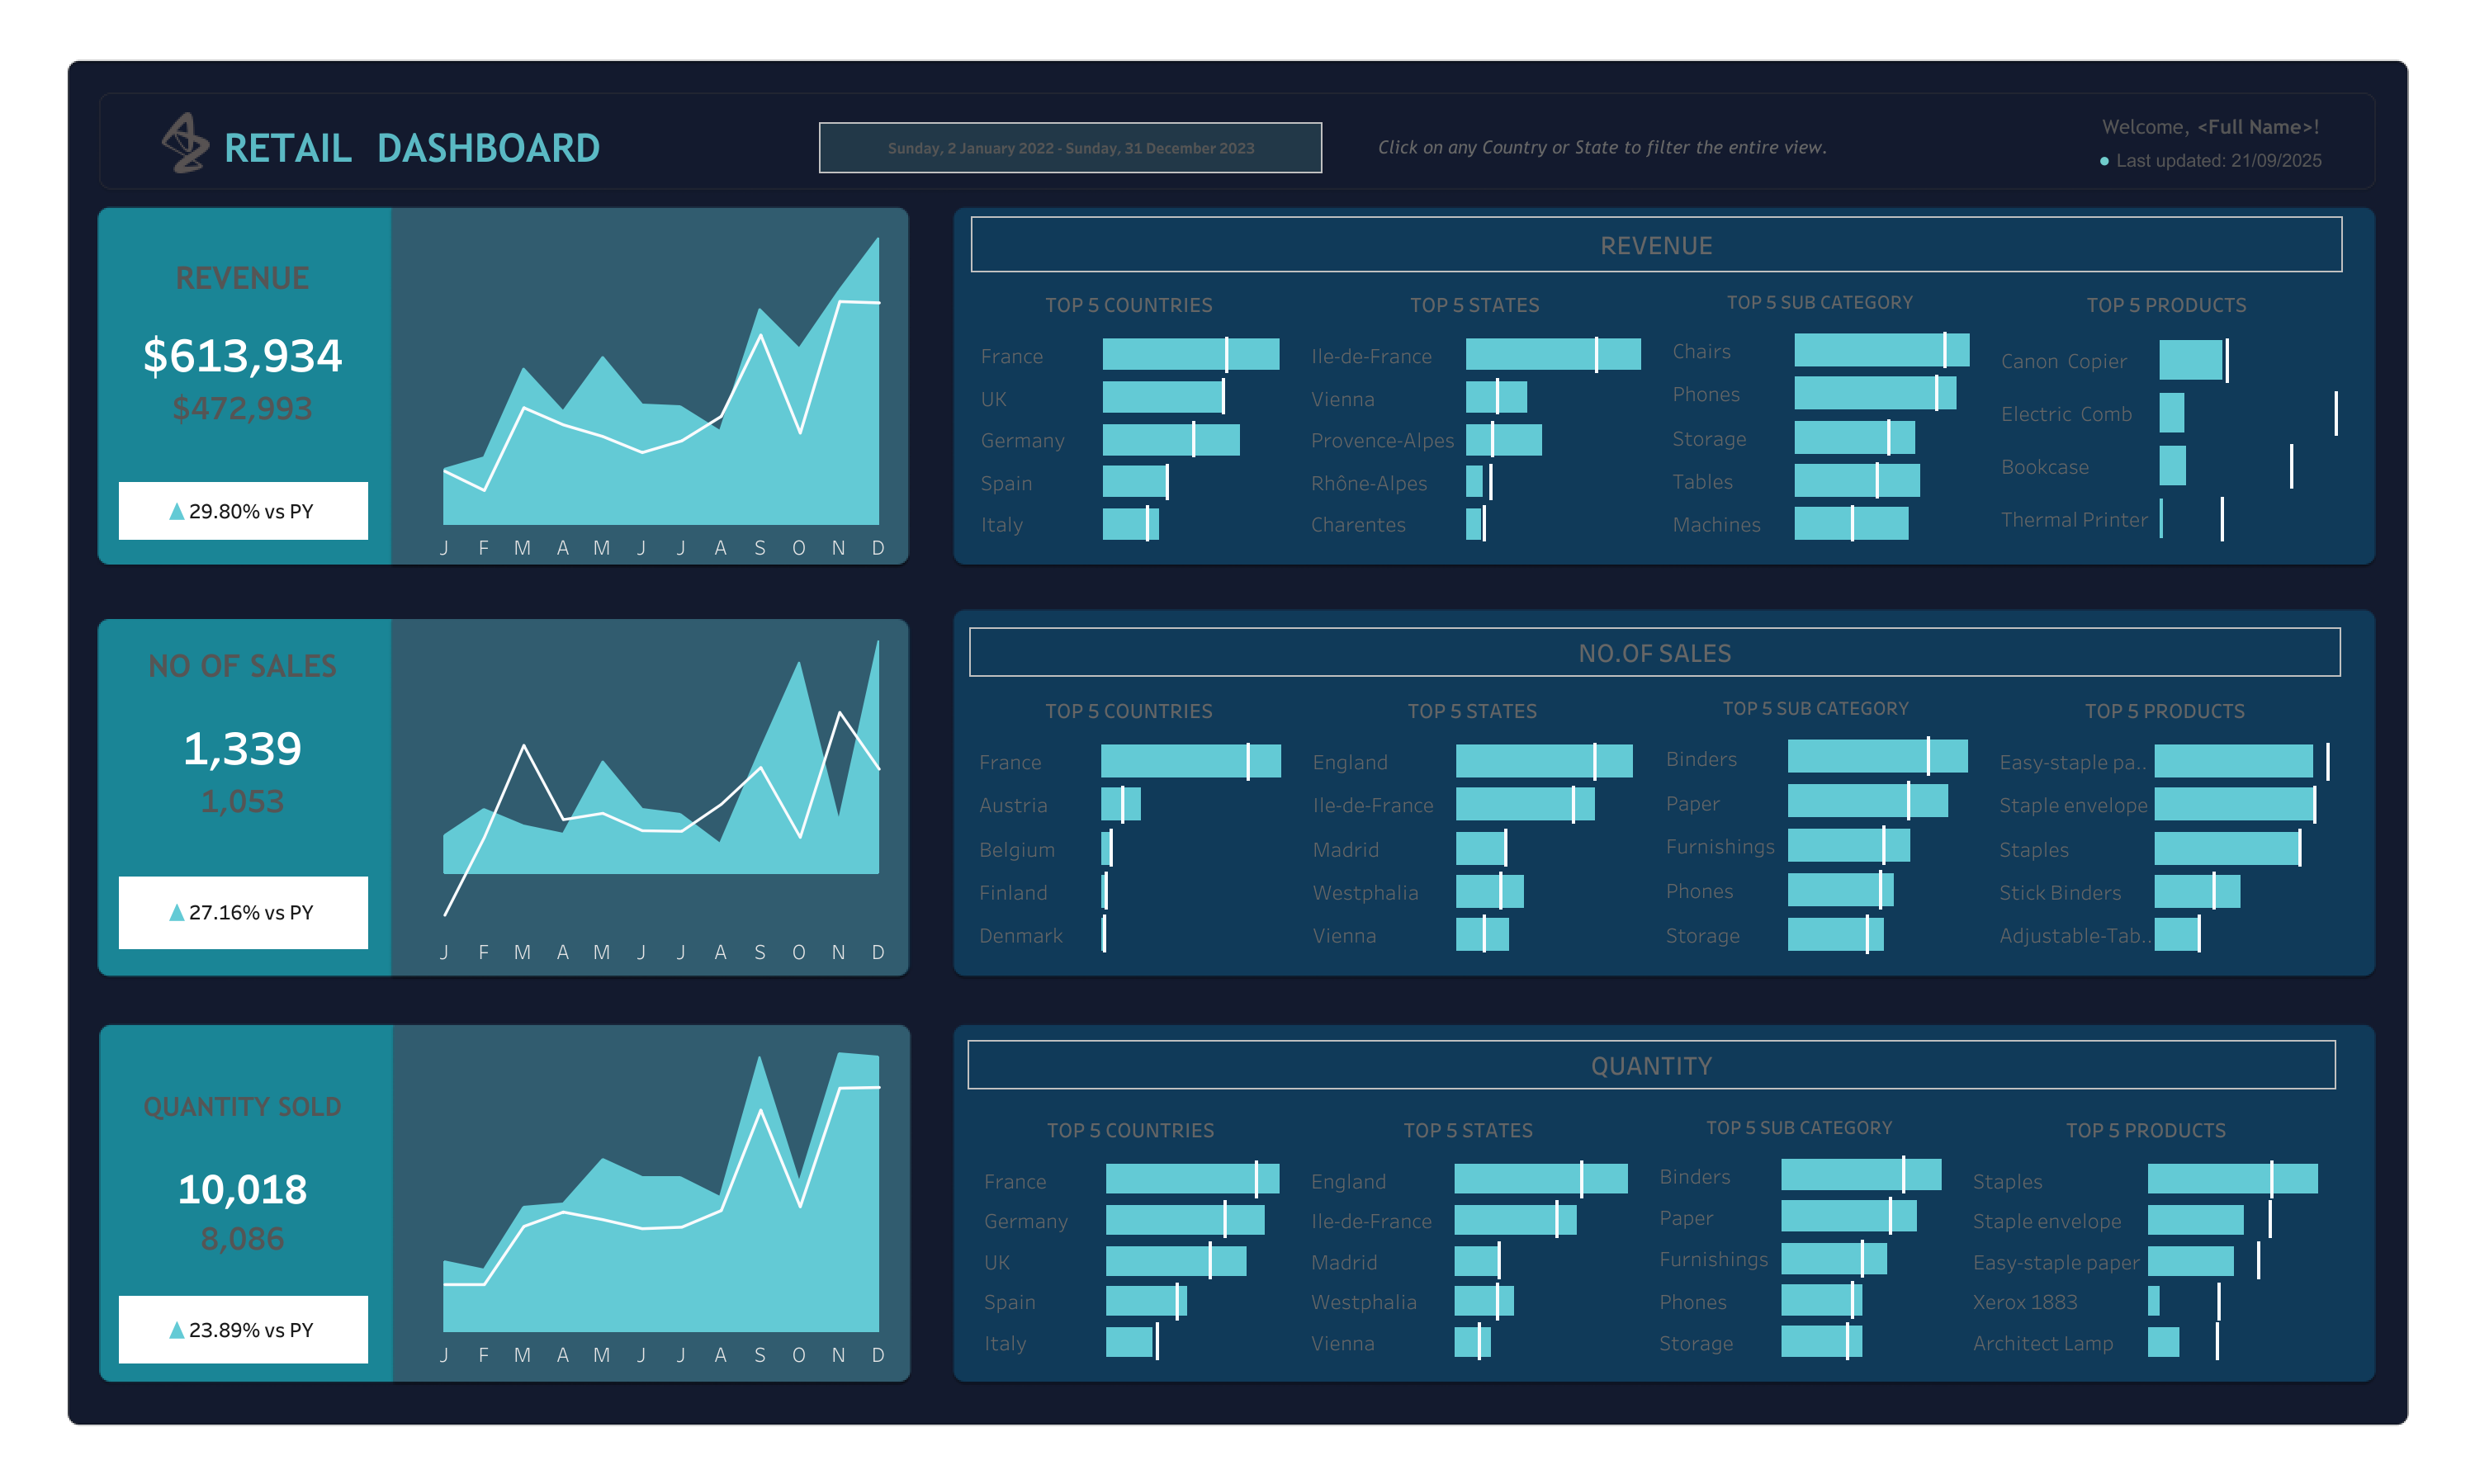
As a Tableau DataDev Ambassador 2024, I specialise in creating user-centric dashboards, applying design thinking, colour psychology, and UX principles. I have published research-backed work on emotional colour palettes and continuously explore ways to elevate data visualisation combining analytical depth with creative design.

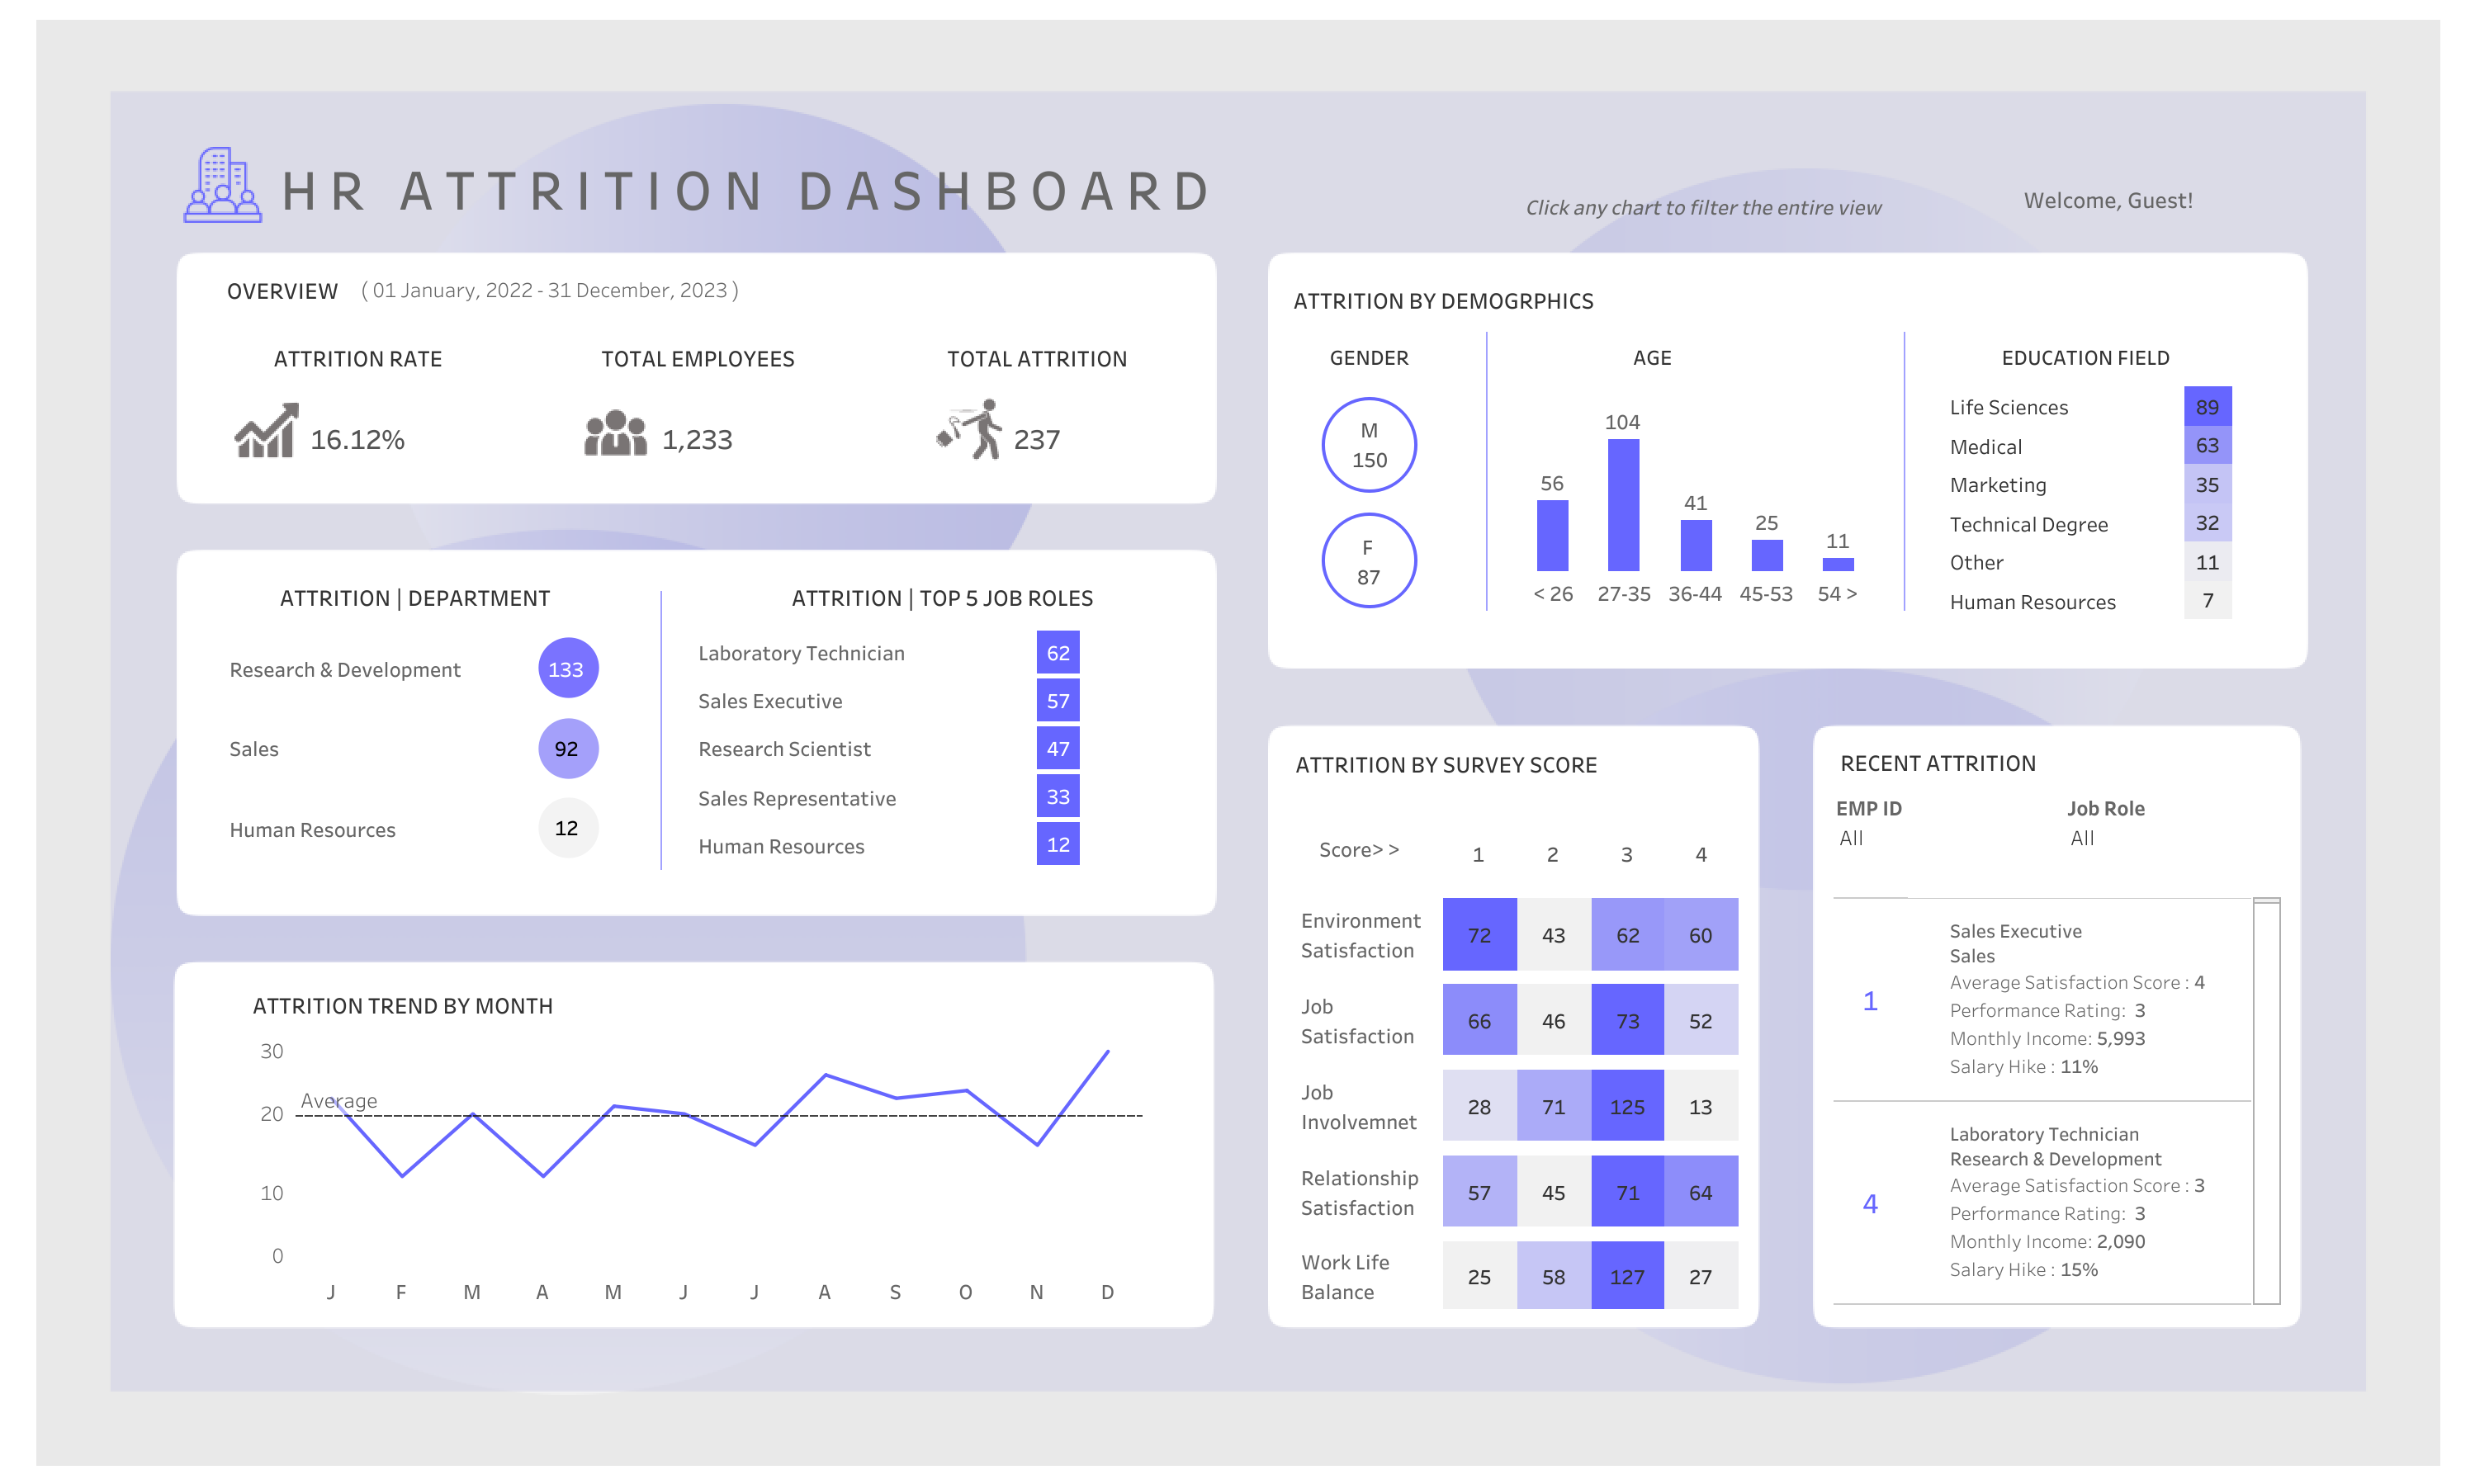
Previously, I gained hands-on experience as a Data Analyst Intern at Valin Technologies in London, where I automated reporting workflows, built KPI dashboards, and conducted segmentation analysis that improved campaign engagement by 25%. Before transitioning into analytics, I worked as a Digital Marketing Assistant Manager, managing campaigns, SEO, and content strategies that boosted brand visibility and lead generation.

I hold a Level 3 Data Technician qualification from Just IT Training, along with certifications from IBM, Google, and Tableau. I also have academic training in International Management and AI foundations. My technical toolkit includes Excel, Tableau, Power BI, SQL, Python, and Azure.

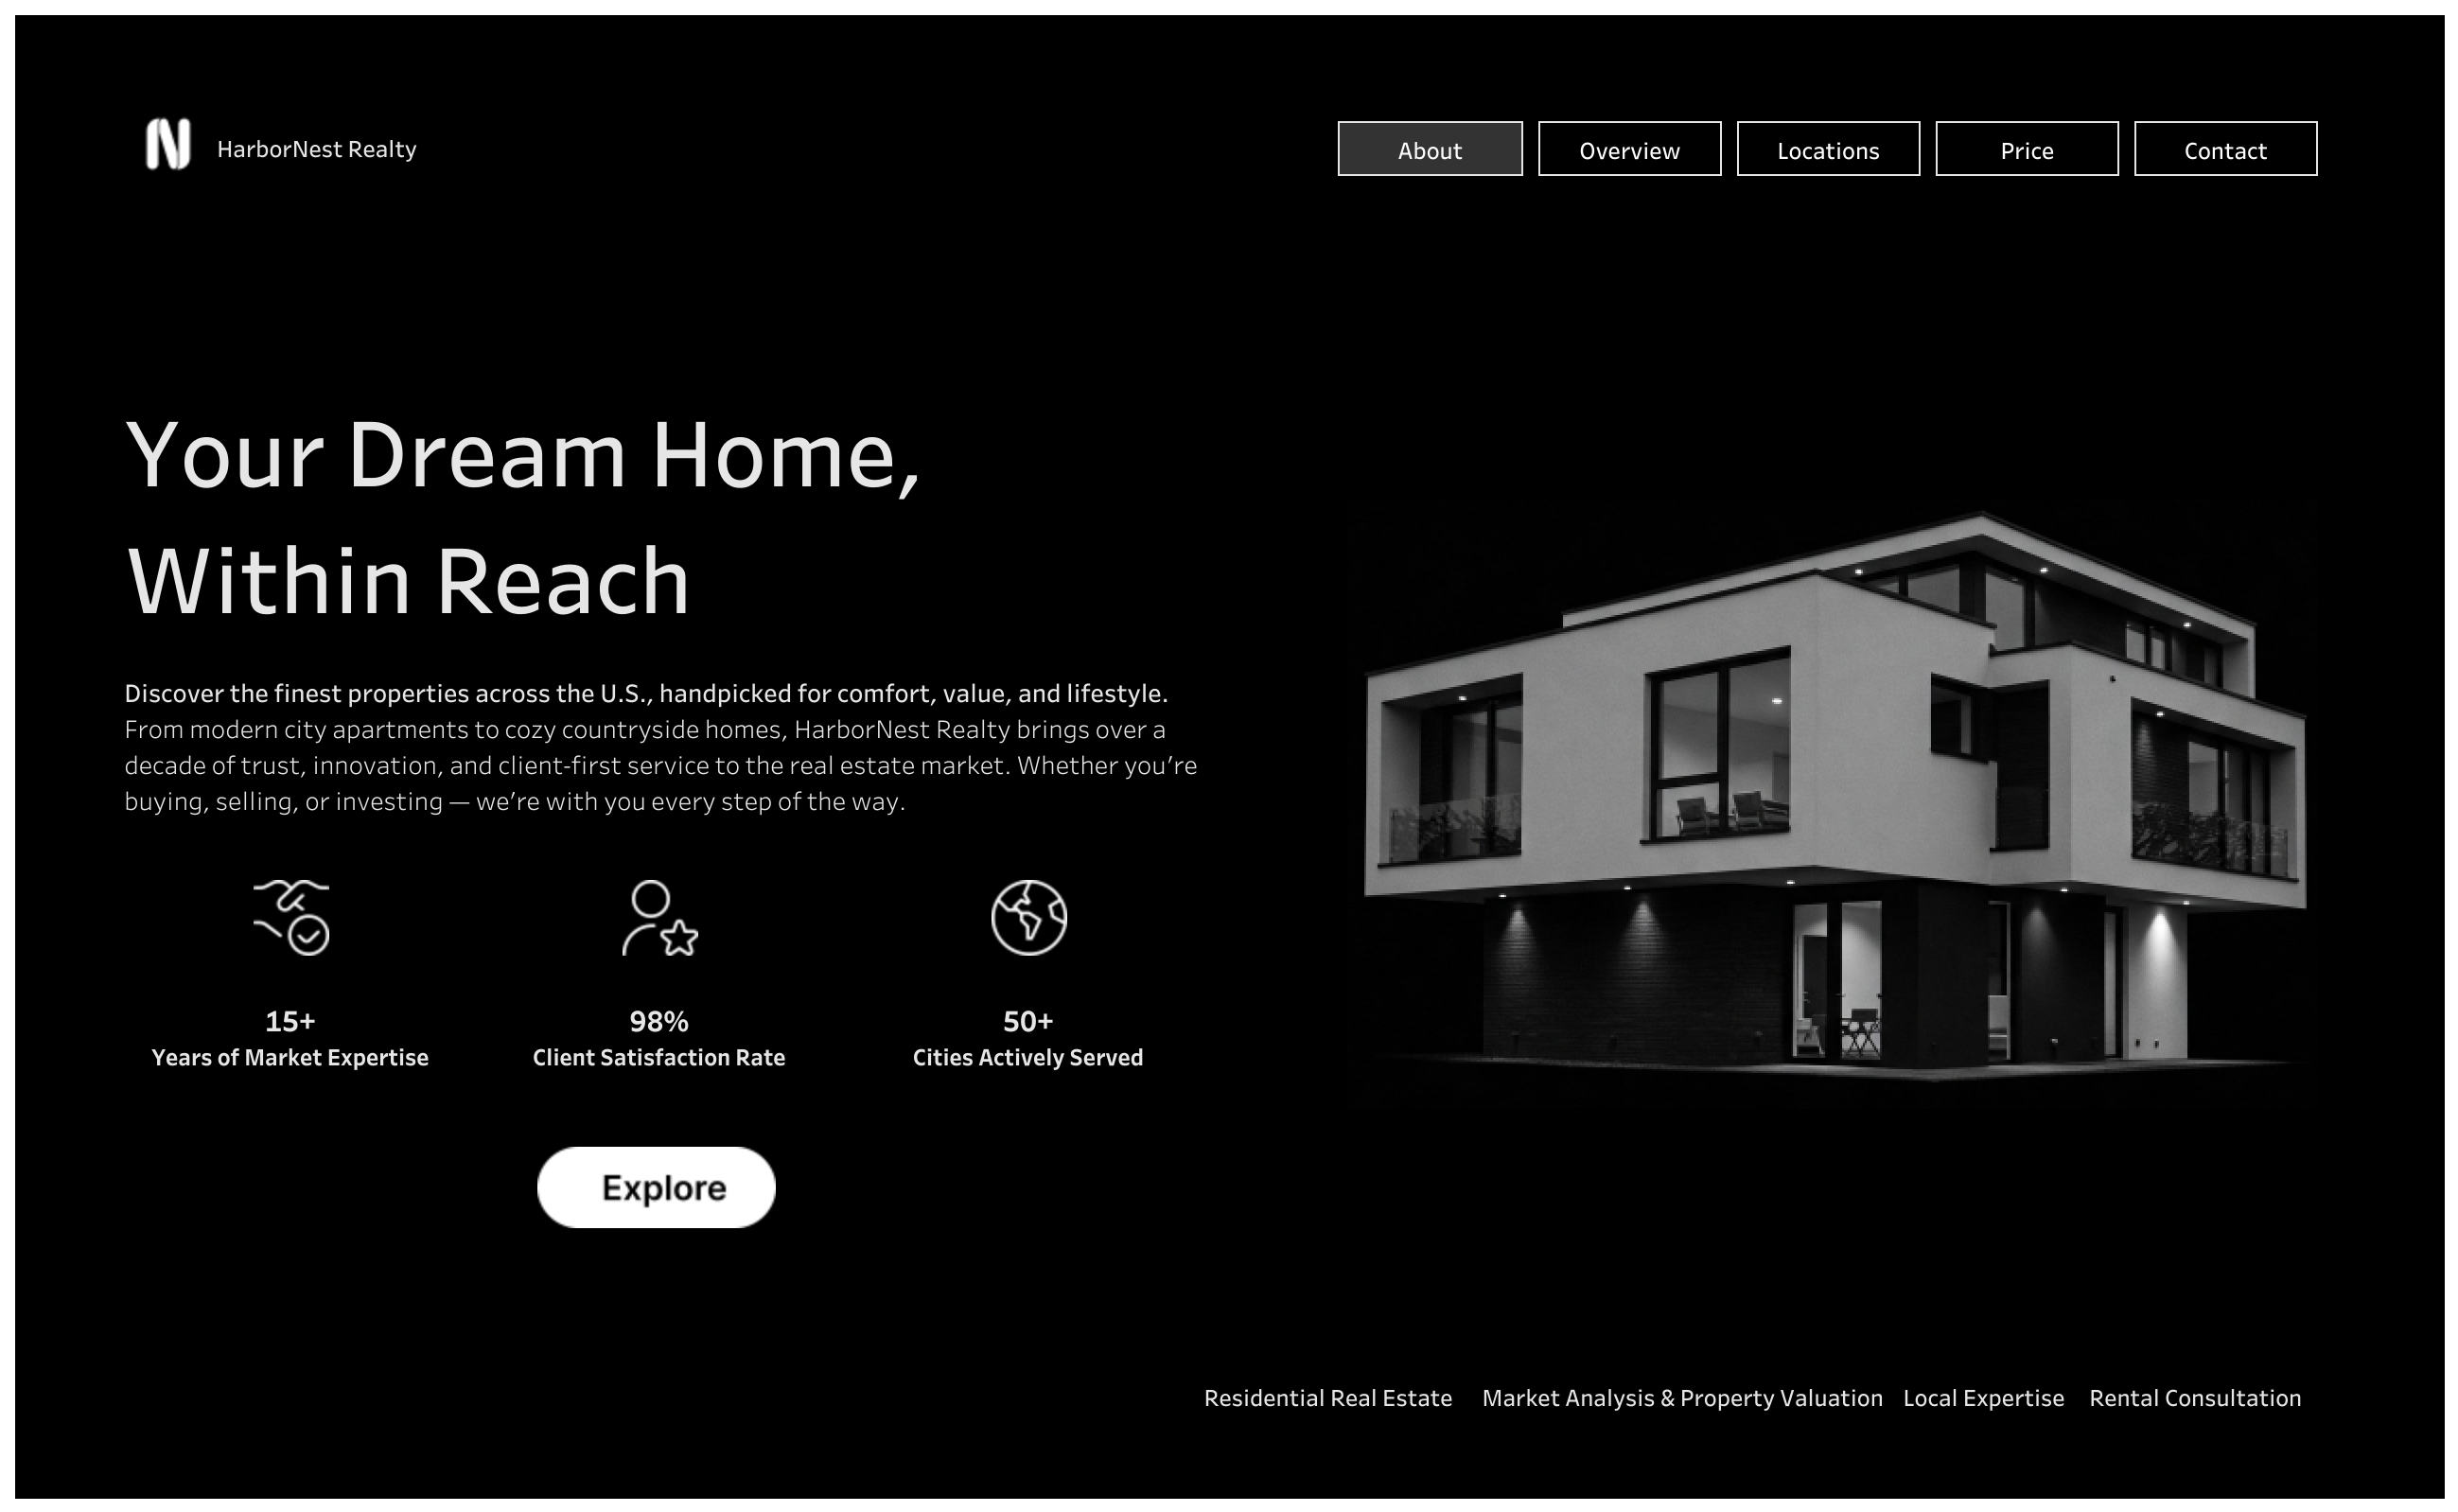
Beyond work, I enjoy painting, photography, videography, and creative hobbies like cooking and candle making. I'm also passionate about technology building websites, creating portfolio projects, and continuously learning to grow as a versatile professional.

I'm driven by the intersection of research, analytics, design and I aim to bring clarity, creativity, and strategic insight to every project I work on.

Athiramol PS

Portfolio

Discover a collection of my projects spanning market research, data analysis, machine learning, web development, and digital marketing.

Digital Marketing Projects

Real‑world campaigns, content creation, and business reports.

Content Design

Engaging visual and written content for social media, blogs, and marketing.

Content Creative

Business Reports & Analytics

Marketing campaign strategies, performance reports, and data‑driven insights.

Reports Analytics

Digital Marketing Portfolio

Collection of real‑world digital marketing projects showcasing strategies and campaigns.

Digital Marketing Portfolio

Market Research Projects

A collection of market research projects focusing on data analysis, consumer insights, competitive analysis, and strategic research methodologies.

Dynamic Premium Optimization Model for Car Insurance Pricing

A sophisticated model for optimizing car insurance premiums based on risk factors and market trends.

Market Research Insurance Optimization

Driving Revenue Through High-Impact PPC Optimization

Strategic PPC campaign optimization to maximize ROI and drive revenue growth.

Digital Marketing PPC ROI Analysis

A/B Testing for Email Campaigns

Comprehensive A/B testing analysis for email marketing campaigns to optimize engagement and conversion rates.

A/B Testing Email Marketing Python

User Engagement Analytics - Web & Mobile Insights

Comprehensive Google Analytics report analyzing user engagement across web and mobile platforms.

Google Analytics User Engagement Web Analytics

Excel: A/B Testing

A/B testing analysis using Excel for marketing campaign optimization and performance measurement.

Excel A/B Testing Marketing Analytics

Customer Segmentation

Advanced customer segmentation analysis to identify key customer groups and tailor marketing strategies.

Customer Segmentation Market Research Data Analysis

Data-Driven Platform Selection

Choosing the Best Social Media Channel for Digital Investment through data analysis and market research.

Social Media Platform Selection Digital Strategy

Data Collection - Instagram Data

Comprehensive data collection and analysis from Instagram for social media insights and trend analysis.

Data Collection Instagram Social Media

Extracting Cryptocurrency Data

Data collection and analysis of cryptocurrency market trends from Yahoo Finance and other sources.

Cryptocurrency Data Collection Financial Data

Data Collection - From Website

Web scraping and data extraction from websites for market research and competitive analysis.

Web Scraping Data Collection Competitive Analysis

Extracting Amazon Reviews

Data collection and sentiment analysis of Amazon product reviews for market insights.

Amazon Sentiment Analysis Review Analysis

Jotform: Survey Designing

Professional survey design and implementation using Jotform for market research data collection.

Jotform Survey Design Market Research

Competitive Analysis

Comprehensive competitive analysis to identify market opportunities and competitive advantages.

Competitive Analysis Market Research Business Strategy

Google Forms: Survey Designing

Professional survey design and implementation using Google Forms for market research.

Google Forms Survey Design Data Collection

Microsoft Forms: Survey Designing

Professional survey design and implementation using Microsoft Forms for market research.

Microsoft Forms Survey Design Data Collection

Google Forms: Poll Designing

Interactive poll design and implementation using Google Forms for quick market feedback.

Google Forms Poll Design Quick Feedback

Report: Pyramid Principle

Structured report writing using the Pyramid Principle for clear and effective communication of research findings.

Report Writing Pyramid Principle Business Communication

A/B test analysis using R

End-to-end A/B testing analysis using R for statistical significance and marketing optimization.

A/B Testing R Programming Statistical Analysis

Market Basket Analysis

Python-based market basket analysis to identify product associations and cross-selling opportunities.

Market Basket Analysis Python Association Rules

Data Projects

My most impactful data analysis and visualization projects demonstrate my ability to transform complex datasets into clear, actionable insights.

Power BI Sales Dashboard

Power BI — Sales Dashboard

Interactive Power BI Sales Dashboard featuring KPIs, top products, and detailed insights for LARA Company.

Power BI DAX Data Modeling
Tableau Admissions Dashboard

Tableau — Admissions Dashboard | Education

Interactive admissions dashboard to visualize applications and enrollments for educational institutions.

Tableau Education Data Visualization
Camden Traffic Accidents Analysis

Tableau — Camden Traffic Accidents Analysis

Interactive Tableau dashboard showing accident severity, trends, and road user involvement in Camden, UK.

Tableau Traffic Analysis Data Visualization
R Exploratory Data Analysis

R – Exploratory Data Analysis

Perform an in-depth exploratory data analysis of employee attrition using R, examining univariate, bivariate and multivariate relationships within the dataset.

R Exploratory Data Analysis HR Analytics
Microsoft Fabric & Power BI

Microsoft Fabric & Power BI

Implement a scalable data lakehouse architecture using Microsoft Fabric together with Power BI to ingest, process, and visualise enterprise-scale retail data for improved forecasting, real-time reporting, and customer personalisation.

Microsoft Fabric Power BI Lakehouse Retail Analytics
RapidMiner Exploratory Data Analysis

RapidMiner – Exploratory Data Analysis

Perform an in-depth exploratory data analysis using RapidMiner on the Sample Superstore dataset, exploring sales, profit, shipping modes, regions, customer segments, and top-performing products to generate actionable business insights.

RapidMiner Exploratory Data Analysis Business Insights
Python HR Data Analysis

Python — End-to-End HR Data Analysis

Clean, analyze, and visualize HR data to guide workforce strategies and improve retention.

Python HR Analytics Workforce Insights
MySQL HR Data Migration

MySQL — HR Data Migration & Employee Insights

Migrate HR data to MySQL, ensure data integrity, and extract actionable employee insights.

MySQL HR Analytics Data Management
Excel Data Profiling

Excel — Data Profiling & Data Cleaning

Profile, clean, and standardize retail dataset for accurate insights and documented cleaning process.

Excel Data Cleaning Retail Analytics
Power BI & PostgreSQL ETL

Power BI & PostgreSQL — ETL Flow for Vehicle Dynamics

Centralize data in PostgreSQL, perform ETL in Power BI, and visualize key performance metrics.

Power BI PostgreSQL ETL
Python Web Scraping

Python — S&P 500 Components Stock Data Web Scraping

Automate the extraction of S&P 500 stock info, clean and structure the data for analysis.

Python Web Scraping Financial Data
Taylor Swift Spotify Dashboard

Tableau — Taylor Swift Spotify Dashboard

Interactive Tableau dashboard with Spotify player, dynamic filters, and visualizations of streaming patterns.

Tableau Music Analytics Data Visualization

Machine Learning Projects

A collection of my most impactful machine learning projects, highlighting how I apply algorithms to solve real-world business problems.

Predicting Car Price

Predicting Car Price by Machine Learning

To create a robust model capable of estimating the price of a car based on various features, including make, model, year, mileage, and other specifications.

Python Linear Regression Data Pre-processing Feature Engineering
Azure Machine Learning

Azure Machine Learning — Retail Sales Forecasting

Build a no-code pipeline in Azure ML Designer to train, score, and evaluate a Linear Regression model for accurate retail sales predictions.

Azure ML Retail Analytics Predictive Modeling No-Code ML
KNIME Analytics

KNIME Analytics – Predicting Salary

Use a no-code workflow in KNIME Analytics Platform to build a regression model that predicts salary based on features like industry, experience, geographic region, and other categorical and numerical variables.

KNIME Salary Prediction Regression Model No-Code Analytics
RapidMiner Customer Loyalty

RapidMiner – Predicting Customer Loyalty

Leverage a no-code workflow in RapidMiner to build a classification model that predicts customer loyalty based on features like purchase history, demographics, engagement metrics, and transaction patterns.

RapidMiner Customer Loyalty Prediction Classification Model Customer Analytics

Web Development Projects

Explore my collection of website design and development projects, blending creativity with functionality.

Website Development

Website Development Portfolio

A comprehensive website development project showcasing modern design principles, responsive layout, and user experience optimization. Built with WordPress to create an engaging online presence.

WordPress Responsive Design UI/UX

WebApps Projects

Developed web applications tailored for different business needs and real-world use cases.

TypeMood

TypeMood

Fonts Based on the Mood

View Project
ColourSense

ColourSense

Colors based on the Mood

View Project
DashTheme Palette

DashTheme Palette

Theme based color palette recommender

View Project
Refilliq Track

Refilliq Track

Smart inventory monitoring for non-technical shop owners

View Project

Dashboards

Explore my interactive data visualization dashboards

Explore my Tableau Dashboards

Alex and Co | Sales Dashboard 2023

Alex and Co — Sales Dashboard

Tableau • Sales Analytics

Executive Performance Dashboard

Executive Performance Dashboard

Tableau • Performance Metrics

Alice Hospital | ER Dashboard

Alice Hospital ER Dashboard

Tableau • Healthcare Analytics

Retail Dashboard | Day Theme

Retail Dashboard | Day Theme

Tableau • Retail Analytics

Retail Dashboard | Dark Theme

Retail Dashboard | Dark Theme

Tableau • Retail Analytics

Tactical Analytics Dashboard | HR Attrition

Tactical Analytics Dashboard | HR Attrition

Tableau • HR Analytics

Web Traffic Dashboard | Digital Marketing

Web Traffic Dashboard | Digital Marketing

Tableau • Digital Marketing

Financial Dashboard | Finance

Financial Dashboard | Finance

Tableau • Financial Analytics

E-Commerce Dashboard | Sales & Marketing

E-Commerce Dashboard | Sales & Marketing

Tableau • E-Commerce Analytics

iPad Layout | Sales Dashboard

iPad Layout | Sales Dashboard

Tableau • Interactive Business Insights

Desktop Layout | E-Commerce Dashboard

Desktop Layout | E-Commerce Dashboard

Tableau • E-Commerce Analytics

Executive Dashboard | Email Campaign Performance

Executive Dashboard | Email Campaign Performance

Tableau • Marketing Analytics

Mobile Phone View | iPhone Layout

Mobile View | iPhone Layout Sales Dashboard

Tableau • Mobile Analytics

Geographical Dashboard | Majestic Peaks

Geographical Dashboard | Majestic Peaks

Tableau • Geographical Analytics

Forecasting Dashboard | Sales

Forecasting Dashboard | Sales

Tableau • Predictive Analytics

C-Suite Dashboard | Sales

C-Suite Dashboard | Sales

Tableau • Executive Analytics

IT Infrastructure Upgrade Tracker

IT Infrastructure Upgrade Tracker

Tableau • IT Project Management

Help Desk Dashboard | Customer Service Support

Help Desk Dashboard | Customer Support

Tableau • Customer Service Analytics

Information Security Risk Management Dashboard

Information Security Risk Management Dashboard

Tableau • Security Analytics

RFM Dashboard

RFM Dashboard

Tableau • Customer Segmentation

Green Energy Dashboard | Energy

Green Energy Dashboard | Energy

Tableau • Energy Analytics

Property Management Dashboard | Real Estate

Property Management Dashboard | Real Estate

Tableau • Real Estate Analytics

Digital Marketing KPI Dashboard

Digital Marketing KPI Dashboard

Tableau • Marketing Analytics

Spotify Dashboard | Taylor Swift

Spotify Dashboard | Taylor Swift

Tableau • Music Analytics

RFM | Dark Theme | UI UX

RFM Dark Theme | UI/UX

Tableau • Customer Analytics

Admissions Dashboard | Education

Admissions Dashboard | Education

Tableau • Education Analytics

Insightful Analytics with Power BI

Root Cause Analysis

Root Cause Analysis

Power BI • Diagnostic Analytics

Sentiment Analysis

Sentiment Analysis

Power BI • Text Analytics

Geo Spatial Analysis

Geo Spatial Analysis

Power BI • Location Analytics

Market Basket Analysis

Market Basket Analysis

Power BI • Customer Analytics

PESTLE Analysis

PESTLE Analysis

Power BI • Strategic Analysis

Market Campaign Analysis

Market Campaign Analysis

Power BI • Marketing Analytics

HR Attrition

HR Attrition

Power BI • HR Analytics

SWOT Analysis

SWOT Analysis

Power BI • Strategic Analysis

Churn Analysis

Churn Analysis

Power BI • Customer Analytics

Cluster Analysis

Cluster Analysis

Power BI • Segmentation Analytics

Demographic Segmentation

Demographic Segmentation

Power BI • Market Segmentation

Product Analysis

Product Analysis

Power BI • Product Analytics

Forecasting Analysis

Forecasting Analysis

Power BI • Predictive Analytics

ABC Classification Analysis

ABC Classification Analysis

Power BI • Inventory Analytics

Other BI Dashboards

Qlik Sense

Qlik Sense End-to-End Project

Qlik Sense • Comprehensive BI Analysis

IBM Cognos Analytics

Data Visualization with IBM Cognos Analytics

IBM Cognos • Data Storytelling & Insights

Zoho Analytics

Zoho Analytics Data Visualization

Zoho Analytics • Business Data Analysis

Google Analytics

Google Analytics Dashboard

Google Analytics • Website Performance Tracking

Google looker Studio

Google Looker Studio – Ad Hoc Reporting

Looker Studio • On-Demand Data Insights

Blog

Thoughts, tutorials, and data stories

Data Analyst with Cool Projects

Read my articles on Medium

Photography

Moments captured through my lens

APS Photography

View my photo album on Facebook

Youtube

Video storytelling and creative projects

One Strong Story

Watch my YouTube channel

Professional Background

Learn more about my experience, education, and professional journey

My Professional Journey

I'm a passionate data professional with a strong foundation in data analysis, visualization, and business intelligence. My journey in data analytics began with a comprehensive 8-week Digital Skills Bootcamp at Just IT Training, UK, where I developed hands-on experience with industry-standard tools and techniques.

Throughout my career, I've focused on transforming complex data into clear, actionable insights that drive business decisions. I specialize in creating interactive dashboards, performing in-depth data analysis, and developing data-driven solutions for various business challenges.

My technical expertise spans across multiple platforms including Tableau, Power BI, Python, SQL, and various data visualization tools. I'm constantly learning and adapting to new technologies and methodologies in the rapidly evolving field of data analytics.

Athiramol PS Professional

Connect With Me

Let’s connect to discuss market research, data analytics, visualisation projects, or new opportunities.

Send a Message

Content Design Showcase

A curated collection of my creative work – social media posts, videos, marketing collaterals, copywriting, and more.